
Packaging Line OEE Calculation and Bottleneck Analysis: PackML States, V-Curve Speeds and SMED
Run a packaging line OEE calculation that separates Availability, Performance and Quality, maps PackML Starved and Blocked timers, and sizes V-curve buffers.
A packaging line OEE calculation equals Availability multiplied by Performance and Quality (or Good Output Count divided by Planned Production Time and Ideal Run Rate) measured at the line's pacing constraint and verified at final good-pack discharge. Because coupled machines propagate upstream Blocked and downstream Starved waits, plant engineers must separate internal fault time (PackML Held/Stopped) from external wait time (PackML Suspended with Blocked/Starved tags), balance station speeds along a V-curve around the core filler, and apply SMED changeover separation before buying faster equipment.
Applies to: Serial packaging lines linking unscramblers, fillers, sealers, labelers, checkweighers, case packers and palletizers. Covers shift-level OEE and TEEP arithmetic, PackML state-timer mapping, V-curve speed and buffer sizing, and SMED changeover separation.
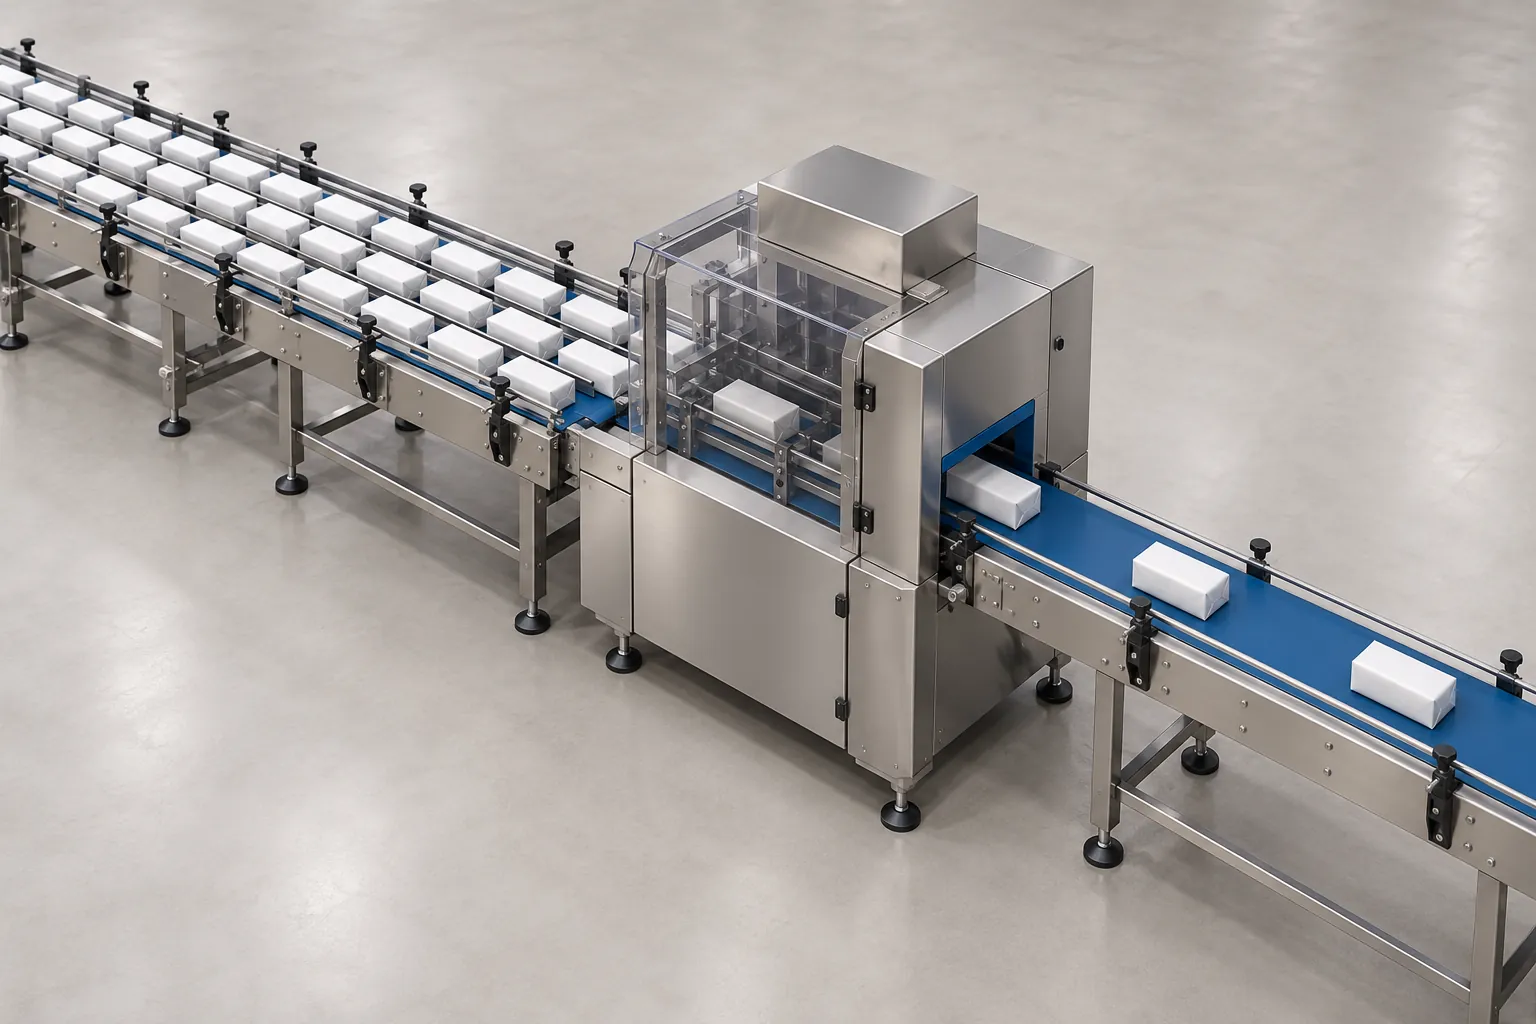
An accurate oee calculation on a serial packaging line measures how effectively coupled machines convert scheduled shift minutes into shippable, specification-compliant packs at the palletizer infeed. When plants calculate Overall Equipment Effectiveness (OEE) on each machine frame in isolation, or average the standalone HMI gauges of five machines in series, the resulting percentage hides the inter-station starvation and blockage cascades that govern real factory output. According to the PMMI Overall Equipment Effectiveness QS 2026 Report, OEE is tracked across 100% of packaging enterprises above $250M in revenue and 93.8% of current system offerings, yet bridging single-machine counters to line-level root-cause visibility remains a primary operational challenge.
To turn shift counters into actionable engineering decisions across plant operations and packaging automation projects, plant teams need four connected tools: a strict ISO 22400-2 time and loss boundary, a PLC state-timer model that separates internal faults from upstream and downstream waits, V-curve speed and accumulation buffer math to absorb micro-stops, and SMED changeover separation to recover scheduled run time.
Why single-machine rated speed and line OEE diverge
A machine’s nameplate speed is the cycle rate achieved on an uninterrupted test bench with uniform empty containers or ideal film rolls. In a production facility, flow wrapper speed and capacity planning data from Soontrue Machinery shows that a horizontal wrapper rated at 200 packs per minute (PPM) often runs closer to 140 PPM once film sealing dwell time, product fragility, infeed pitch variations, and format changeovers enter the shift equation. Meeting an 80,000-pack target across an 8-hour (480-minute) shift with 30 minutes of scheduled breaks leaves 450 minutes of available window, requiring nearly 178 PPM of continuous net output before a single film splice or jam occurs.
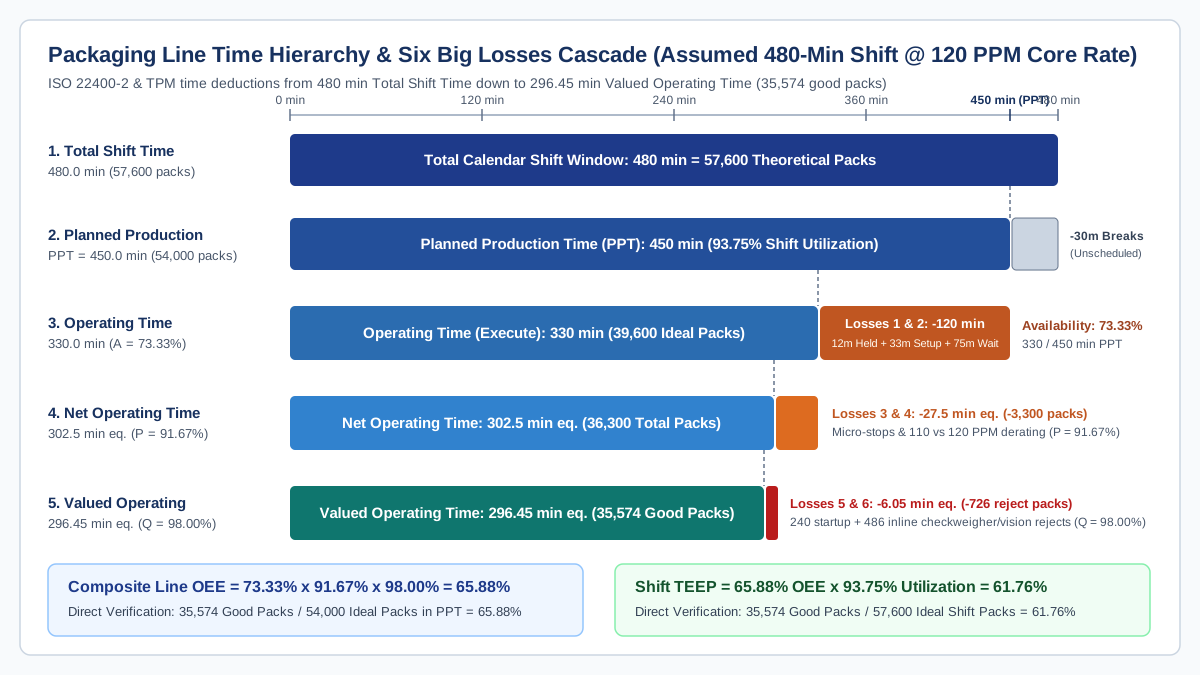
Manufacturing KPI standard ISO 22400-2 and Total Productive Maintenance (TPM) literature organize shift time into a strict deductive cascade. Each tier subtracts one pair of the Six Big Losses from the total clock window:
Swipe sideways to see the other columns. The first column stays visible.
| Time tier or metric | Engineering equation | Six Big Losses deducted at this boundary | Counting rule for serial packaging lines |
|---|---|---|---|
| Total Calendar / Shift Time | Total elapsed clock minutes in the shift or day (for example, 480 min per 8-hour shift) | None (baseline denominator for TEEP) | Fixed by shift schedule |
| Planned Production Time (PPT) | PPT = Total Shift Time - Planned Downtime |
Unscheduled shifts, statutory breaks with the line stopped, planned preventive maintenance windows | Never reclassify routine format changeovers or material waits as Planned Downtime to inflate OEE |
| Operating Time (Run Time) | Operating Time = PPT - Unplanned Stop Time |
Loss 1: Equipment breakdowns (internal faults) and Loss 2: Setup and format changeovers (plus cascade waits at the reference pacer) | Measured in PackML ST_Execute at the core pacing station |
| Net Operating Time | Net Operating Time = Operating Time - Speed Losses = Total Pack Count * Ideal Cycle Time |
Loss 3: Idling and minor stops (micro-stops under 2 to 5 min) and Loss 4: Reduced operating speed below Ideal Run Rate | Compare actual cycles against the validated design rate (Ideal Run Rate), not a derated operator dial setting |
| Valued Operating Time | Valued Operating Time = Net Operating Time - Quality Loss Time = Good Pack Count * Ideal Cycle Time |
Loss 5: Startup and warm-up rejects after changeover or thermal soak and Loss 6: Steady-state inline inspection rejects | Count verified good packs exiting the final checkweigher, vision, metal detector, and case-packing boundary |
Availability (A) |
A = Operating Time / PPT |
Captures Losses 1 and 2 (plus unbuffered line wait cascade) | Expressed as a decimal or percentage of Planned Production Time |
Performance (P) |
P = (Total Count * Ideal Cycle Time) / Operating Time = Total Count / (Operating Time * Ideal Run Rate) |
Captures Losses 3 and 4 | Identifies sub-minute micro-stops and speed derating that never trigger a manual downtime log |
Quality (Q) |
Q = Good Count / Total Count = (Total Count - Startup Rejects - Run Rejects) / Total Count |
Captures Losses 5 and 6 | Requires separate PLC registers for total cycles, startup purge rejects, and running rejects |
| Composite Line OEE | OEE = A * P * Q = Good Count / (PPT * Ideal Run Rate) |
Combined Availability, Performance, and Quality losses inside Planned Production Time | Must match the direct ratio of verified good packs at end-of-line to theoretical output in PPT |
Total Effective Equipment Performance (TEEP) |
TEEP = OEE * Utilization = Good Count / (Total Shift Time * Ideal Run Rate) |
All Six Big Losses plus schedule utilization losses (Utilization = PPT / Total Shift Time) |
Exposes schedule manipulation when teams move changeovers or cleaning out of PPT |
Two rules keep this oee calculation honest during capital reviews and packaging machine total cost of ownership evaluations:
- Anchor
Ideal Run Rate(and its reciprocal,Ideal Cycle Time) to the core pacing machine’s validated design speed for that SKU. If a filler is designed for 120 PPM (0.50 seconds/pack), lowering the HMI speed pot to 100 PPM to stop liquid splashing is a 16.7% Performance loss (P = 83.3%), not a license to reset the ideal rate to 100 PPM. - Track
TEEPalongsideOEE. If a plant reclassifies a 45-minute daily format changeover from Unplanned Setup Loss into Planned Downtime,PPTshrinks andOEEartificially jumps, whereasTEEPand cases shipped to the warehouse remain unchanged.
Mapping PackML states to separate internal faults from Starved and Blocked waits
On a coupled packaging automation line, visual observation during a stop frequently misleads troubleshooting. As Syntegon’s production data analysis with Synexio demonstrates, floor teams naturally walk to the machine that has visibly stalled, even when the stop was triggered seconds earlier by a downstream backup or an upstream empty conveyor. When every stop is lumped into a single generic “Down” counter, the core filler appears unreliable whenever downstream labelers or cartoners choke.
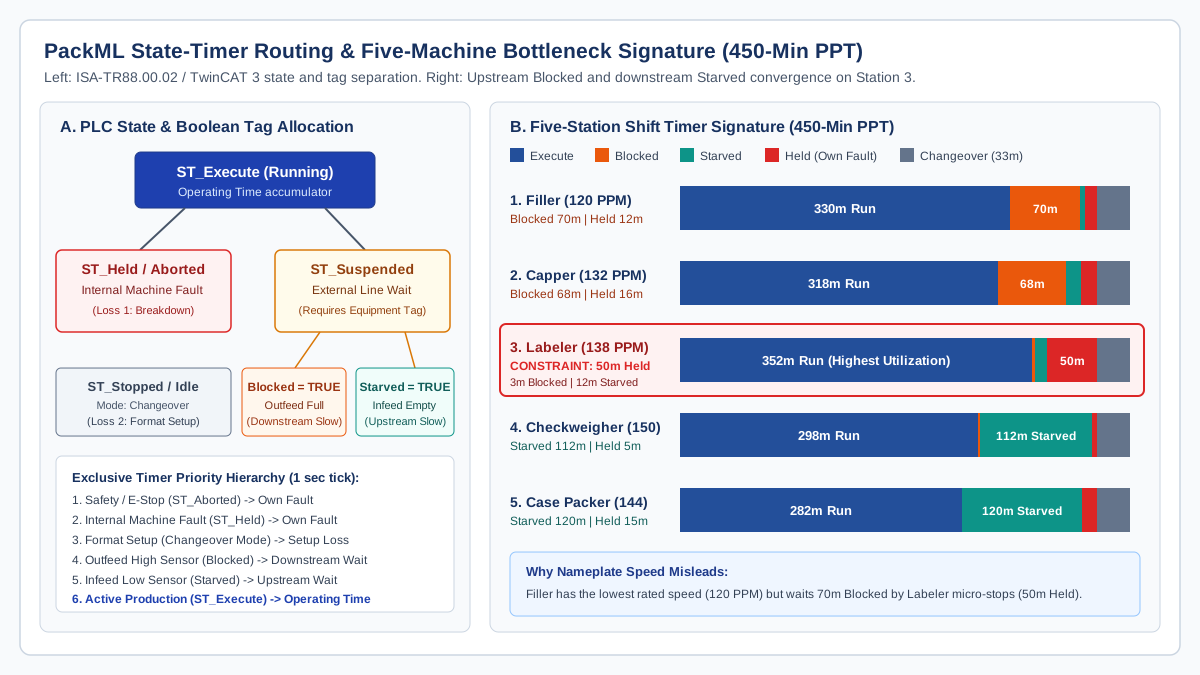
The OMAC PackML technical standard (formalized as ISA-TR88.00.02) solves this attribution problem by separating internal machine faults from external line conditions inside each machine controller. In standard PLC libraries such as Beckhoff’s TwinCAT 3 PS_PackML_StateMachine_Auto, the 17-state model routes non-running time into distinct acting and wait states:
ST_Execute: The machine is actively cycling product under normal automatic control. Time accumulated here forms theOperating Timenumerator.ST_Held(entered viaST_Holdingon aHoldcommand) andST_Aborted/ST_Stopped: The machine has stopped due to an internal condition on its own frame, such as a servo overload, broken cross-seal knife, heater fault, low film/label web on its own spindle, or an opened safety guard.ST_Suspended(entered viaST_Suspendingon aSuspendcommand): The machine is healthy and ready to cycle, but an external process condition upstream or downstream prevents product flow.
Crucially, as documented in Beckhoff’s ST_PMLEquipment structure (Tc3_PackML_V3), ST_Suspended by itself does not distinguish whether the machine is waiting for incoming product or waiting for space to discharge. The PLC must pair ST_Suspended with two boolean equipment tags: ST_PMLEquipment.Starved (TRUE when the infeed low-level sensor is uncovered) and ST_PMLEquipment.Blocked (TRUE when the outfeed high-level sensor is covered).
When specifying machine interfaces with the packaging line integration checklist and configuring PLC, HMI and motion control registers, program a deterministic priority order so simultaneous conditions never double-count shift minutes:
Swipe sideways to see the other columns. The first column stays visible.
| Priority rank | PLC condition evaluated each 1-second tick | PackML state and tag | OEE Six Big Losses bucket | Diagnostic meaning on the line |
|---|---|---|---|---|
| 1 (Highest) | Safety circuit trip or emergency stop active | ST_Aborted / ST_Aborting |
Loss 1: Equipment breakdown (Availability) | Immediate safety or catastrophic drive intervention on this station |
| 2 | Internal machine fault or local consumable empty | ST_Held / ST_Holding |
Loss 1: Equipment breakdown (Availability) | True internal reliability or reel-replenishment stop on this station |
| 3 | Unit mode set to Changeover or Manual Setup | ST_Stopped / ST_Idle (Changeover Mode) |
Loss 2: Setup and format changeover (Availability) | Internal SMED setup window between last good pack of SKU A and first good pack of SKU B |
| 4 | Outfeed discharge queue full (downstream backup) | ST_Suspended + Blocked = TRUE |
Cascade wait (reduces line Availability at pacer) | Downstream machine or conveyor cannot accept output; root cause sits downstream |
| 5 | Infeed supply queue empty (upstream gap) | ST_Suspended + Starved = TRUE |
Cascade wait (reduces line Availability at pacer) | Upstream machine failed to deliver containers; root cause sits upstream |
| 6 (Lowest) | Automatic cycling with speed below or at ideal rate | ST_Execute (CurMachSpeed vs MachSpeed) |
Operating Time (speed delta goes to Loss 3 and 4) | Active production; sub-minute pauses and speed trim show up in Performance (P) |
Worked shift OEE calculation and five-machine bottleneck walk-through
To see how PackML state timers and the three OEE factors interact on a coupled line, examine an assumed 8-hour (480-minute) shift across a five-station rigid container line: a core liquid Filler (nameplate Ideal Run Rate = 120 packs/min, or 0.50 s/pack), a rotary Capper (132 packs/min), a pressure-sensitive Labeler (138 packs/min), an inline Checkweigher and vision combo (150 packs/min), and a Case Packer (144 packs/min equivalent).
Scheduled breaks with the line stopped total 30 minutes, leaving a Planned Production Time (PPT) of 480 - 30 = 450 minutes. Every station undergoes a simultaneous 33-minute format changeover during the shift. The table below records the assumed 450-minute PackML state distribution across all five controllers, building on the four-state diagnostic framework introduced in finding packaging line bottlenecks with basic production data:
Swipe sideways to see the other columns. The first column stays visible.
| Station and nameplate Ideal Run Rate | ST_Execute Running (min) |
ST_Suspended Starved (min) |
ST_Suspended Blocked (min) |
ST_Held Own Fault (min) |
Changeover Stopped (min) | Total PPT Check (min) | Station diagnostic signature |
|---|---|---|---|---|---|---|---|
1. Core Filler (120 PPM / 0.50 s/pack) |
330 | 5 | 70 | 12 | 33 | 450 | Intrinsic machine availability without external waits is (450 - 12 - 33) / 450 = 90.00%, but 70 min of downstream blockage forces effective running time down to 330 min (73.33%) |
2. Rotary Capper (132 PPM) |
318 | 15 | 68 | 16 | 33 | 450 | Heavily blocked (68 min) by the queue before the Labeler; passes the blockage wave backward to the Filler |
3. Pressure-Sensitive Labeler (138 PPM) |
352 | 12 | 3 | 50 | 33 | 450 | Active line constraint: highest running share (352 min), nearly zero blocked time (3 min), and 50 min of internal ST_Held faults from 36 micro-stops of 60 to 90 seconds |
4. Checkweigher & Vision (150 PPM) |
298 | 112 | 2 | 5 | 33 | 450 | Starved for 112 min waiting for labeled containers; only 5 min of own internal faults |
5. Case Packer (144 PPM eq.) |
282 | 120 | 0 | 15 | 33 | 450 | Starved for 120 min; excess speed (144 PPM) rapidly drains incoming packs whenever the Labeler runs |
Step-by-step shift OEE and TEEP arithmetic
Using the core Filler (120 packs/min reference rate) as the line pacing denominator and verifying total and good pack counts at end-of-line discharge after the checkweigher and metal detector combo system:
- Planned Production Time (
PPT) and Theoretical Output:PPT = 480 min - 30 min = 450 minTheoretical Maximum Output in PPT = 450 min * 120 packs/min = 54,000 packsTheoretical Shift Calendar Output = 480 min * 120 packs/min = 57,600 packs
- Line Availability (
A):- At the pacing Filler, total non-running time inside
PPTis12 min (Held) + 33 min (Changeover) + 5 min (Starved) + 70 min (Blocked) = 120 min. Operating Time = 450 min - 120 min = 330 minAvailability (A) = 330 min / 450 min = 0.73333 (73.33%)- Notice why standalone OEM dashboards deceive plant managers: if the Filler vendor’s HMI excludes the
75 minutesof externalST_Suspendedwait time, the Filler screen reports(450 - 45) / 450 = 90.00%availability while the plant loses70 minutesof filler capacity to downstream blockage.
- At the pacing Filler, total non-running time inside
- Line Performance (
P):- During its
330 minutesinST_Execute, the line discharges36,300 total packs( an effective running average of36,300 / 330 = 110.0 packs/mindue to speed derating and sub-minute sensor hesitations). Net Operating Time = 36,300 packs * 0.50 s/pack = 18,150 s = 302.50 min equivalentPerformance (P) = 36,300 packs / (330 min * 120 packs/min) = 36,300 / 39,600 = 0.91667 (91.67%)
- During its
- Line Quality (
Q):- First-off tuning after the changeover purging cycle accounts for
240 startup reject packs, and steady-state checkweigher and label-vision kick-outs account for486 run reject packs(Total Rejects = 726 packs). Good Pack Count = 36,300 - 726 = 35,574 good packsValued Operating Time = 35,574 packs * 0.50 s/pack = 17,787 s = 296.45 min equivalentQuality (Q) = 35,574 / 36,300 = 0.98000 (98.00%)
- First-off tuning after the changeover purging cycle accounts for
- Composite Line OEE and TEEP:
Line OEE = 0.73333 * 0.91667 * 0.98000 = 0.6588 (65.88%)Direct Check = 35,574 good packs / 54,000 theoretical packs in PPT = 65.88%Schedule Utilization = 450 min PPT / 480 min Shift = 0.9375 (93.75%)Shift TEEP = 0.6588 * 0.9375 = 0.6176 (61.76%), or35,574 / 57,600 = 61.76%
Proving the active constraint from the PackML matrix
A superficial glance at machine nameplate ratings points to the Filler (120 PPM) as the slowest machine on the line. The PackML state matrix proves the opposite: the Filler suffered only 12 minutes of internal faults (ST_Held) but sat Blocked for 70 minutes because its discharge conveyor was backed up. The blockage wave travels through the Capper (68 minutes Blocked) and terminates at Station 3, the 138 PPM Labeler.
Before the Labeler, stations are heavily Blocked (70 min and 68 min). After the Labeler, the Checkweigher (112 min Starved) and Case Packer (120 min Starved) sit waiting for product. The Labeler itself is almost never blocked (3 min) or starved (12 min), logs the highest active running time on the line (352 min), and accumulates 50 minutes of ST_Held time across 36 short web-tack, glue, and splice stops of 60 to 90 seconds each. Speeding up the 120 PPM Filler without fixing the Labeler’s micro-stops and buffer capacity will only fill the upstream conveyor faster and increase Filler Blocked time.
V-curve speed balancing and accumulation buffer sizing for micro-stops
As E-PAK Machinery’s filling line integration guide explains, the filler is the pacing foundation of a liquid or rigid packaging line: if transfer plates, guide rails, or unsynchronized conveyor speeds allow upstream backups or downstream gaps, the filler is forced into stop-start cycling that ruins fill accuracy and degrades line OEE.
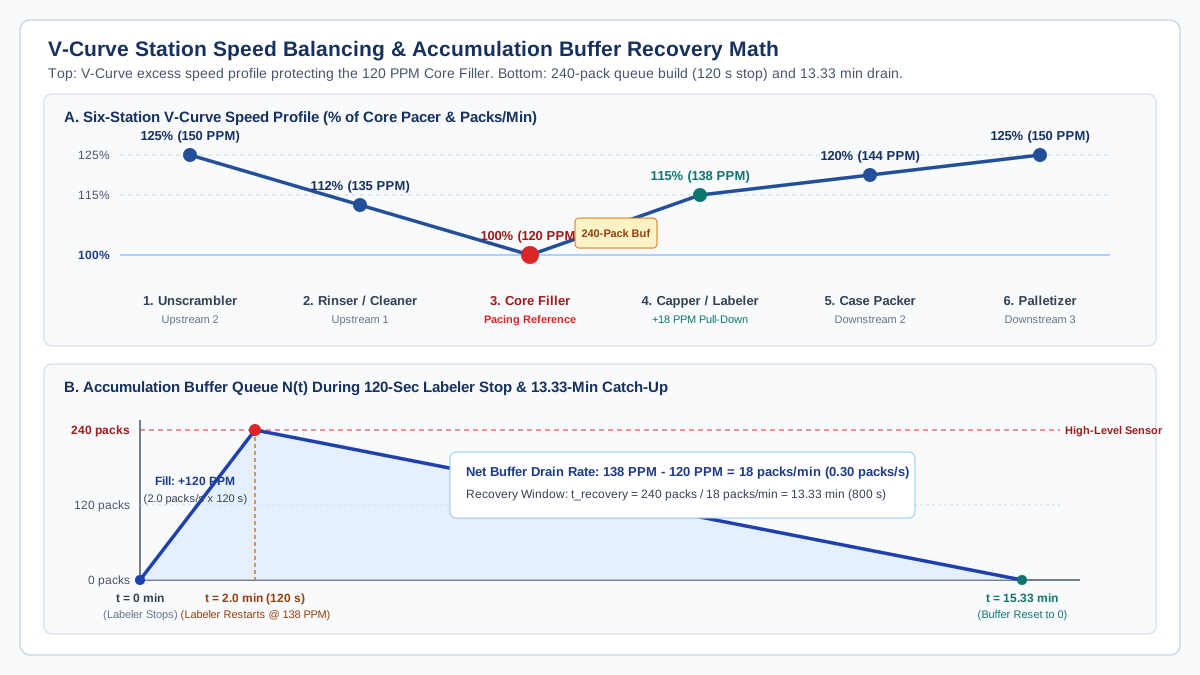
To protect the core pacing machine from both upstream starvation and downstream micro-stop blockages, packaging systems engineers tune station speeds along a V-curve (V-graph) speed profile paired with controlled accumulation buffers. The core filler runs at a constant 100% reference rate (v_core), while every station further upstream and downstream is specified and tuned with progressively higher catch-up speed capability:
Swipe sideways to see the other columns. The first column stays visible.
| Line position | Station example | V-curve speed multiplier (% of v_core) |
Target run rate for 120 PPM core filler |
Dynamic buffer control logic (low / medium / high sensors) |
|---|---|---|---|---|
| Upstream 2 | Bulk Unscrambler / Depalletizer | 125% to 130% |
150 to 156 packs/min |
Runs at nominal 105% when infeed queue is full; ramps to 125%+ after a bulk bin reload to refill the prime backlog |
| Upstream 1 | Bottle Rinser / Air Cleaner | 110% to 115% |
132 to 138 packs/min |
Maintains a continuous flooded prime queue at the Filler infeed worm so Starved time at the Filler stays near zero |
| Core Pacer | Liquid Filler / VFFS Bagger / Thermoformer | 100% (Reference) |
120 packs/min (2.00 packs/s) |
Runs at steady, unmodulated centerline speed; never sped up or slowed down for routine queue fluctuations |
| Downstream 1 | Capper / Labeler / Checkweigher | 110% to 115% |
132 to 138 packs/min (2.20 to 2.30 packs/s) |
Runs at 100% (120 PPM) when upstream buffer is empty; ramps to 115% (138 PPM) when buffer passes medium level to pull down accumulated packs |
| Downstream 2 | Secondary Cartoner / Case Packer | 115% to 120% |
138 to 144 packs/min (2.30 to 2.40 packs/s) |
Absorbs carton-magazine blank loading pauses and drains the primary-to-secondary accumulation table |
| Downstream 3 | Palletizer & Stretch Wrapper | 125% to 130% |
150 to 156 packs/min equivalent |
Rapidly clears case conveyor queues after full-pallet discharge and slip-sheet insertion cycles |
Accumulation buffer sizing equations
An excess speed rating on the Labeler (138 PPM vs 120 PPM) cannot prevent Filler blockage during a 90-second label splice if the conveyor between them holds only 15 containers. The live empty accumulation capacity (N_buffer, measured in packs between the normal operating level and the high-level sensor that triggers Blocked = TRUE at the Filler) must equal the core filler’s flow rate multiplied by the design micro-stop survival window (t_stop):
- Required live buffer capacity (
N_buffer):N_buffer = v_core * t_stop - Net buffer pull-down rate (
delta_v) after the downstream station restarts:delta_v = v_downstream - v_core - Buffer recovery time (
t_recovery) required to empty the queue back to zero:t_recovery = N_buffer / (v_downstream - v_core) = (v_core * t_stop) / (v_downstream - v_core)
Applying these equations to the worked 120 PPM Filler (v_core = 120 packs/min = 2.00 packs/s) and 138 PPM Labeler (v_downstream = 138 packs/min = 2.30 packs/s) for a target 120-second (2.0-minute) reel-splice and jam-clear survival window:
N_buffer = 2.00 packs/s * 120 s = 240 packsof live empty accumulation capacity between the Capper/Filler discharge and the Labeler infeed.- When the Labeler restarts after a 120-second stop, the buffer holds
240 packs. The Labeler ramps to its V-curve catch-up rate of138 packs/minwhile the Filler continues feeding at120 packs/min, creating a net pull-down rate ofdelta_v = 138 - 120 = 18 packs/min (0.30 packs/s). - The time required to drain all 240 packs and reset the buffer to zero is
t_recovery = 240 packs / 18 packs/min = 13.33 minutes (800 seconds).
Notice the ratio: at a 15% V-curve over-speed (v_downstream = 1.15 * v_core), draining a full buffer takes 1 / 0.15 = 6.67 times as long as the stop that filled it (13.33 min / 2.0 min = 6.67). If the Labeler suffers another 90-second micro-stop only 5 minutes later, the buffer is still more than half full and hits the high-level sensor early, forcing the Filler into ST_Suspended (Blocked). Therefore, buffer hardware must always be paired with preventive maintenance on the Labeler’s splice, glue, and photo-eye components so the mean time between micro-stops exceeds t_recovery.
When selecting buffer hardware during packaging automation system scoping, match the conveyor architecture to container stability as classified in Ideal Pase’s accumulation design guidance:
- Minimal back-pressure flat drive belts or rotary tables: Suited to rigid, uniform cylindrical containers absorbing short delays; avoid excessive line pressure on variable-diameter or lightweight bottles that can pivot side-by-side and wedge against guide rails.
- Medium-pressure roller accumulation: Suited to rigid cartons, shrink bundles, and corrugate cases moving between secondary packaging and palletizing.
- Zero-contact / zero-pressure Motor-Driven Roller (MDR) or pneumatic zone conveyors: Essential for fragile glass, unstable tapered containers, or flexible pouches where collision back-pressure causes tipping, label scuffing, or seal damage.
Recovering Availability and Quality with SMED changeover separation
While V-curve buffers attack cascade waiting losses, multi-SKU packaging lines frequently lose 30 to 90 minutes per shift to format changeovers (Loss 2 in Availability) and another 200 to 500 packs per restart to trial-and-error tuning (Loss 5 in Quality). Applying Shigeo Shingo’s Single-Minute Exchange of Die (SMED) methodology alongside the seven-step verification sequence in the packaging format changeover checklist converts stopped machine time into external preparation done while the previous order is still in ST_Execute.
As documented in Wolf Packing’s multi-size quick-changeover benchmarks, combining external staging with tool-less modular jaw clamps (3-minute swap), servo-driven rail positioning, and touchscreen HMI storage for 50 to 200+ SKU parameter recipes compresses 30-to-90-minute format swaps to under 15 minutes (and down to 5 to 9 minutes on automated frames, a 70% to 88% reduction).
Swipe sideways to see the other columns. The first column stays visible.
| SMED conversion stage | Traditional internal practice (machine stopped) | Engineered external or streamlined practice | OEE factor improved | Typical time or scrap saved per changeover |
|---|---|---|---|---|
| 1. Separate External from Internal setup | Operator stops the line, then walks to the tool crib to locate starwheels, forming collars, film reels, and lot paperwork | Stage pre-inspected format parts on a color-coded shadow cart, verify material lot numbers, and print labels while Run A is still in ST_Execute |
Availability (A) |
Saves 10 to 20 min of stopped search and transport time |
| 2. Convert Internal tasks to External | Wait 15 min after restart for sealing jaws or hot-melt glue pots to reach operating temperature; thread new film/label webs from scratch | Pre-heat spare modular sealing assemblies offline; use dual-mandrel unwind stands with pre-prepared splice tables | Availability (A) and Quality (Q) |
Saves 8 to 15 min of thermal soak wait and eliminates cold-seal startup rejects |
| 3. Streamline remaining Internal mechanical work | Loosen 16 hex bolts with wrenches and adjust conveyor guide rails using a tape measure | Fit quarter-turn cam levers, captive quick-release pins, digital spindle indicators (Siko counters), or servo auto-positioning axes | Availability (A) |
Compresses mechanical part swap to 3 to 6 min per station |
| 4. Lock first-off centerlines in HMI recipes | Nudge registration photo-eyes, dwell timers, and filler dosing strokes by trial and error over the first 10 minutes of running | Recall version-controlled PLC/HMI recipe parameters paired with physical mechanical scale readings; verify via first-off check | Quality (Q) and Performance (P) |
Cuts startup purge rejects by 60% to 85% and achieves 100% target speed immediately |
Quantified OEE jump in the worked shift scenario
Applying both V-curve buffer sizing and SMED changeover separation to the worked 450-minute PPT shift demonstrates how much capacity sits inside an existing 120 PPM line before any higher-speed filler is purchased:
- SMED Availability recovery: Cutting format changeover time from
33 minutesto12 minutesreturns+21 minutesdirectly toOperating Time. - Buffer and PM Availability recovery: Installing the 240-pack accumulation buffer before the Labeler and addressing its top splice/sensor faults absorbs
55 of the 70 minutesof FillerBlockedtime, returning another+55 minutestoOperating Time. - New Operating Time and Availability: Filler
Operating Timerises from330 minutesto330 + 21 + 55 = 406 minutesout of450 minutes PPT, raising Line Availability (A) from73.33%to90.22%. - Resulting Line OEE and Output: Holding Performance steady at
91.67%and Quality at98.00%, composite Line OEE jumps from65.88%to0.9022 * 0.9167 * 0.9800 = 81.05%. Good output rises from35,574 packsto43,767 packsper shift (+8,193 additional good packs per shift, a23.0%throughput gain) with zero increase in the Filler’s120 PPMnameplate speed.
Questions to ask suppliers and shift OEE audit checklist
When drafting equipment specifications or preparing acceptance protocols with the FAT versus SAT packaging equipment guide, require machine builders and line integrators to expose standardized state and counter registers:
- Does the PLC publish the complete ISA-TR88.00.02 (PackML) state model over OPC UA or EtherNet/IP, and are
ST_PMLEquipment.BlockedandST_PMLEquipment.Starvedexposed as separate boolean tags alongsideST_Suspended? - Are cumulative state timers (
Execute,Held,Suspended-Blocked,Suspended-Starved,Stopped-Changeover) maintained inside the PLC in 1-second increments so brief micro-stops under 60 seconds are captured accurately? - What exact container, film specification, fill volume, and environmental conditions define the quoted
Ideal Run Rate, and what continuous V-curve over-speed (115% to 125%) can downstream stations sustain during buffer recovery without accelerating wear? - Do inline inspection systems provide separate hardware counters for total cycles, startup/changeover purge rejects, checkweigher weight rejects, and metal/vision rejects?
- How do the accumulation conveyor high, medium, and low level sensors modulate upstream and downstream VFD speeds (ramp-down vs hard stop) to prevent container tipping?
Use the checklist below to execute a five-shift OEE and bottleneck audit on an installed line:
- Lock the Ideal Run Rate (packs/min) and Ideal Cycle Time (seconds/pack) for each SKU at the core pacing machine using the validated engineering specification.
- Verify that Planned Production Time (PPT) excludes only true unscheduled time and statutory breaks, keeping format changeovers, cleaning, and material waits inside the OEE calculation.
- Audit the PLC priority hierarchy across all coupled stations so ST_Held (internal fault) always takes precedence over ST_Suspended (Blocked or Starved), preventing double-counted minutes.
- Log 5 consecutive shifts of PackML state minutes (Execute, Starved, Blocked, Held, Changeover) and verify that every row sums to PPT.
- Locate the active bottleneck where upstream stations accumulate high Blocked time and downstream stations accumulate high Starved time.
- Calculate required live accumulation capacity (N_buffer = v_core * t_stop) and recovery time (t_recovery = N_buffer / [v_downstream - v_core]) around the constraint before modifying conveyor speeds.
- Video-record a format changeover at the constraint station, separate External preparation from Internal stopped work, and verify that all mechanical and HMI settings are locked into a versioned changeover sheet.
FAQ
Should packaging line OEE be calculated by averaging the OEE of every machine on the line?
No. Averaging standalone machine OEE percentages across a serial line produces a mathematically invalid figure because upstream Blocked time and downstream Starved time are symptoms of the constraint propagating through the conveyors, not independent losses at each station. Calculate line OEE at the core pacing constraint and verify the numerator using final good packs discharged at the end of the line divided by (Planned Production Time * Ideal Run Rate).
Do format changeovers count as Planned Downtime or Unplanned Availability Loss in an OEE calculation?
In standard ISO 22400-2 and TPM OEE definitions, format changeovers and setup adjustments (Loss 2 of the Six Big Losses) remain inside Planned Production Time as an Availability loss. Reclassifying changeovers into Planned Downtime shrinks the PPT denominator and artificially inflates OEE Availability while hiding the exact setup minutes that SMED engineering should reduce. Tracking TEEP alongside OEE prevents schedule boundary manipulation.
Why does PackML ST_Suspended require separate Blocked and Starved boolean tags?
The PackML ST_Suspended state indicates only that a machine is healthy and waiting on an external line condition. Without pairing ST_Suspended with ST_PMLEquipment.Blocked (outfeed high-level sensor covered) and ST_PMLEquipment.Starved (infeed low-level sensor uncovered), an OEE historian cannot tell whether the stop originated upstream or downstream, making it impossible to locate the inflection point across the line where Blocked transitions to Starved.
How much faster should downstream packaging machines run on a V-curve relative to the core filler?
Downstream machines immediately following the core filler (such as cappers, labelers, and checkweighers) are typically tuned to run at 110% to 115% of the core filler’s run rate, secondary cartoners and case packers at 115% to 120%, and end-of-line palletizers at 125% to 130%. At a 15% speed advantage (138 PPM vs 120 PPM), a downstream labeler drains an accumulation buffer in 6.67 times the duration of the micro-stop that filled it (13.33 minutes of recovery for a 2.0-minute stop).
References
- ISO 22400-2:2014 — Automation systems and integration — Key performance indicators (KPIs) for manufacturing operations management — Part 2: Definitions and descriptions — ISO
- ISA-TR88.00.02-2022 — Machine and Unit States: An implementation example of ISA-88.00.01 — ISA
- PackML (Packaging Machine Language) - OMAC — OMAC (Organization for Machine Automation and Control)
- Shigeo Shingo, A Revolution in Manufacturing: The SMED System (translated by Andrew P. Dillon; Productivity Press, 1985) — Productivity Press (now Routledge/Taylor & Francis)
- Seiichi Nakajima, Introduction to TPM: Total Productive Maintenance (Productivity Press, 1988) — Productivity Press
- Eliyahu M. Goldratt and Jeff Cox, The Goal: A Process of Ongoing Improvement (North River Press, first published 1984) — North River Press
Update history
- : First published.
- : Published complete shift OEE and TEEP equations, PackML V3 Blocked/Starved timer allocation, five-machine bottleneck matrix, V-curve buffer sizing math, and SMED changeover conversion table.
Next steps
Finding Packaging Line Bottlenecks with Basic Production Data
Identify candidate packaging-line constraints using four analysis groups, measured good-pack counts and running rates, with a worked example and copyable shift log.
Read guide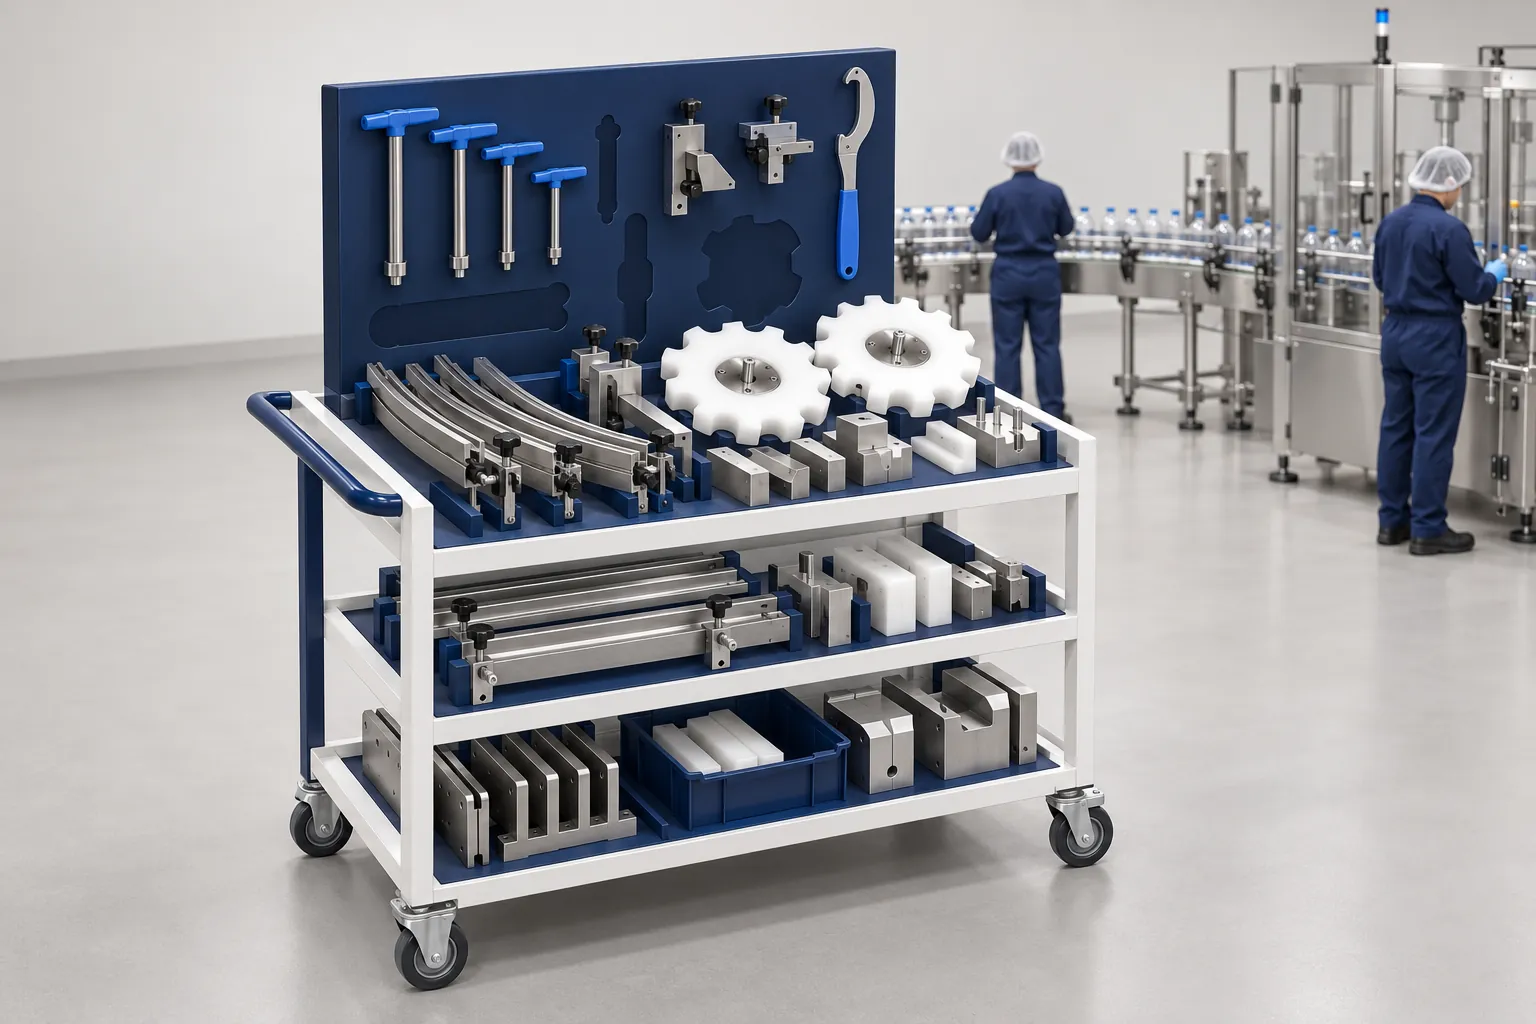
Packaging Format Changeovers: What to Record and Verify
A format changeover checklist: seven steps from preparation to run monitoring, a record template, and the SMED idea of external versus internal work.
Read guide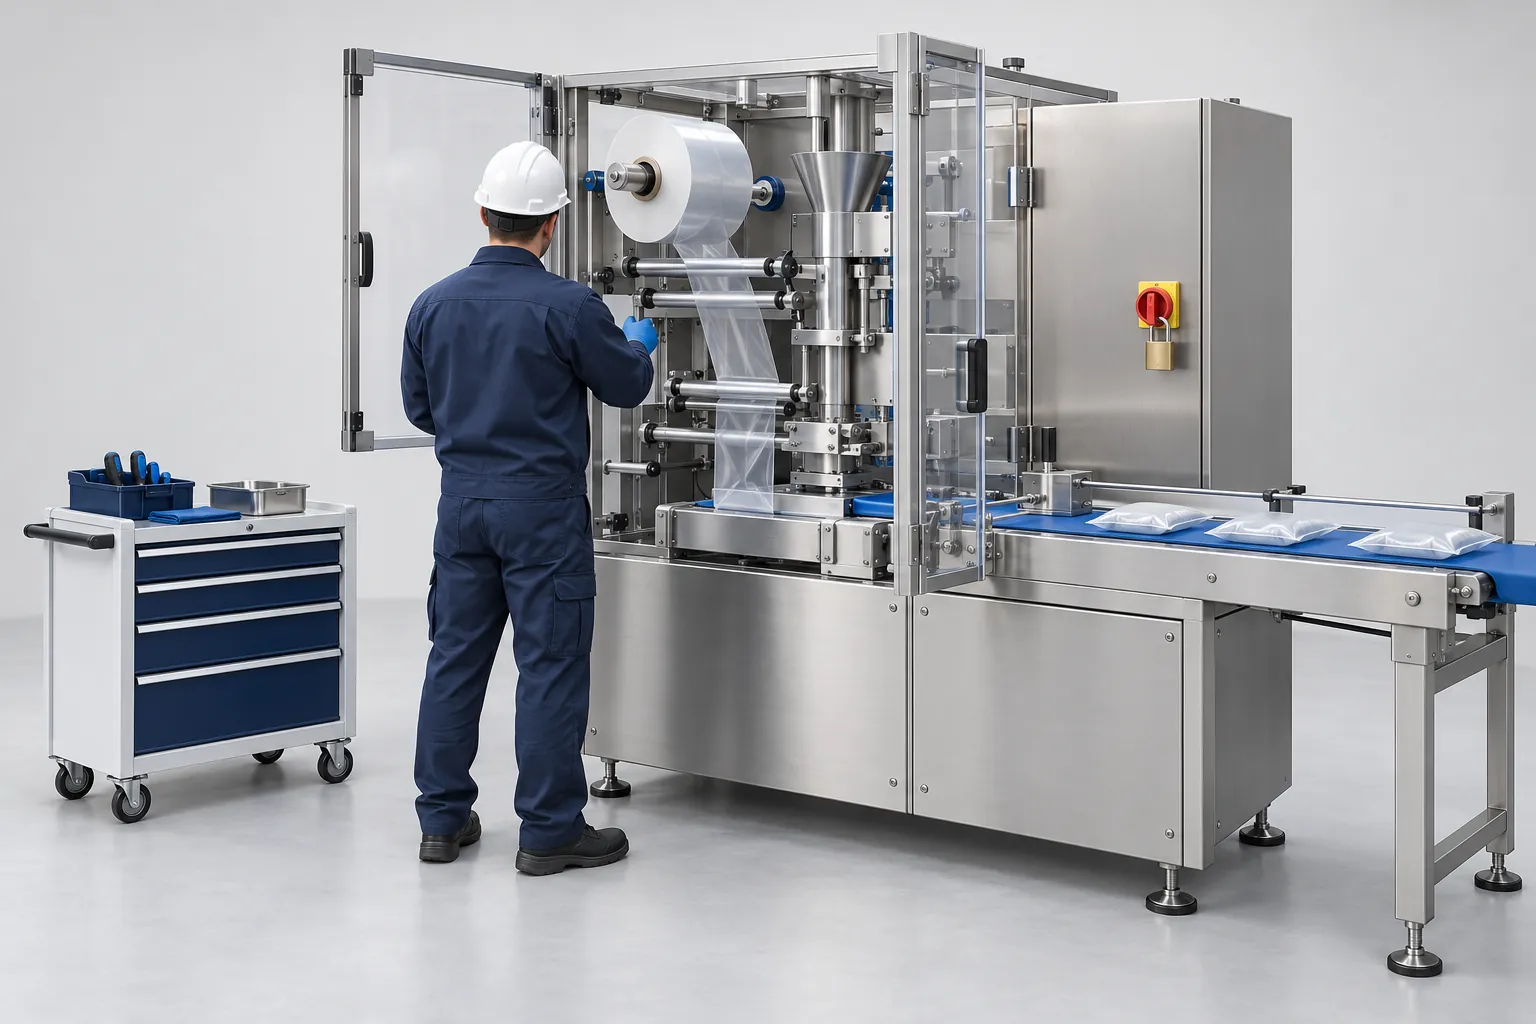
Packaging Machine Preventive Maintenance: Building a Site-Specific Checklist
Build a preventive maintenance checklist for packaging machines from OEM manuals, failure history, risk assessment and critical spares, with a task list.
Read guide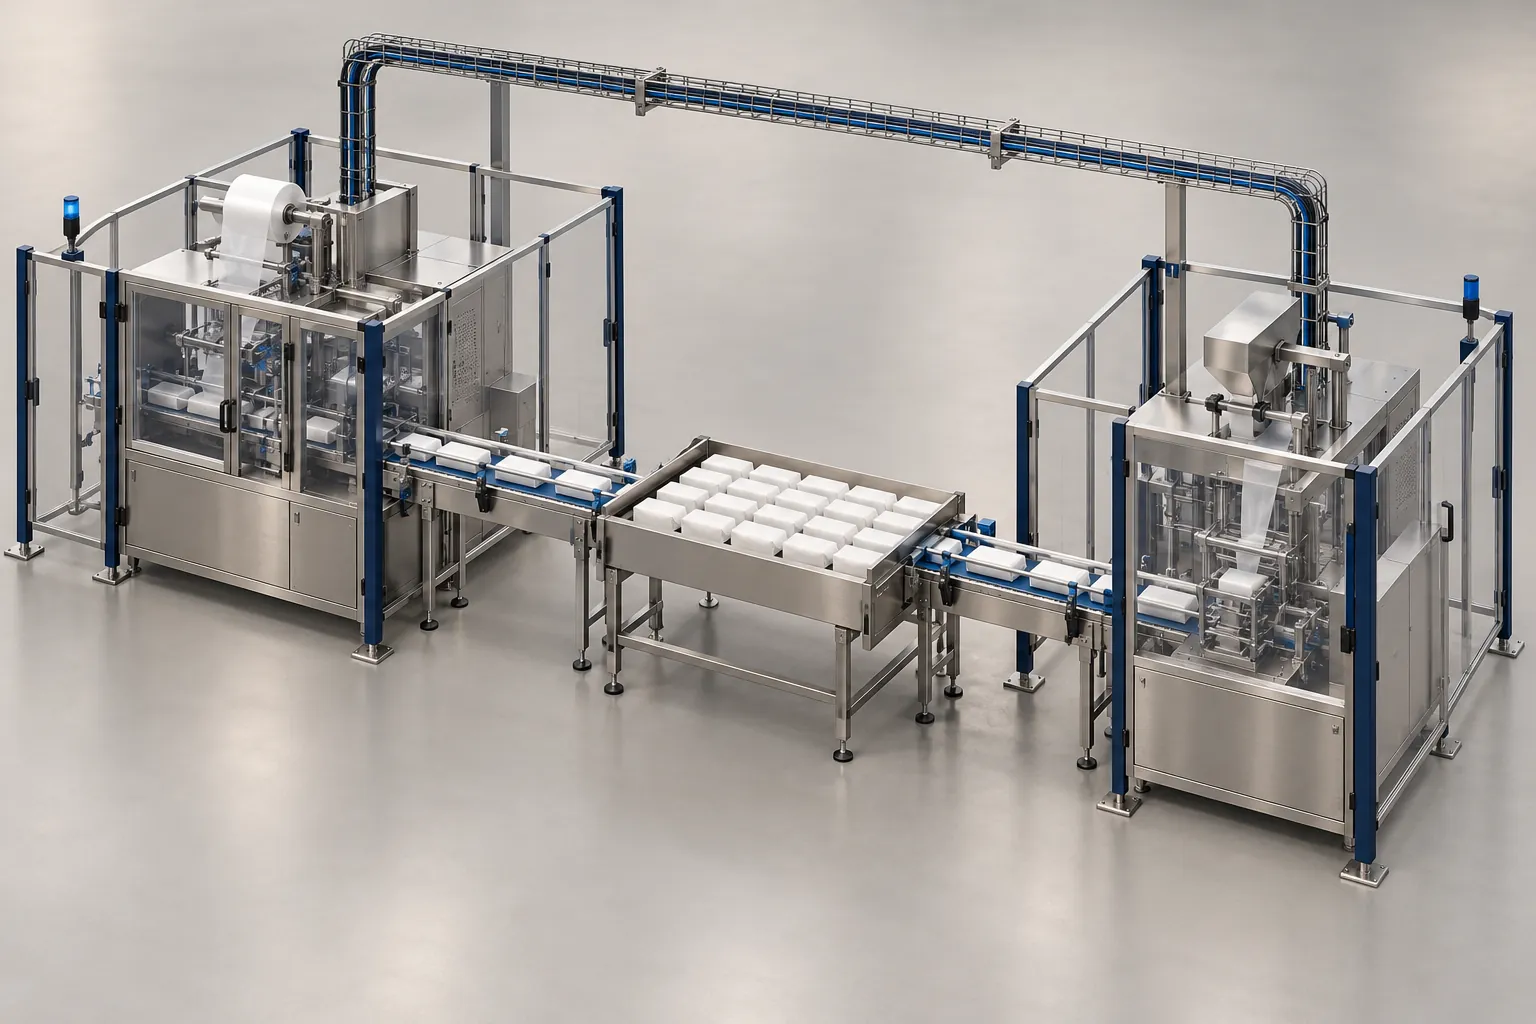
Packaging Line Integration Checklist: Interfaces to Confirm Before Ordering
Checklist of mechanical, electrical, signal, communication, safety and utility interfaces to settle before ordering a machine for a packaging line.
Read guide