
Packaging Machine Total Cost of Ownership: A Comparison Framework
Compare packaging machine offers by total cost of ownership: cost components, a fill-in table, an example with invented numbers and a sensitivity check.
In this simplified undiscounted model, TCO equals acquisition plus years times annual operation, maintenance and non-overlapping downtime/changeover costs, plus decommissioning minus residual value. A lower purchase price can still be the more expensive choice when changeovers, scrap, energy or maintenance differ, so compare offers on the same cost structure and test how sensitive the result is.
Applies to: Covers a comparison framework for new standalone packaging machines and small cells. It uses invented numbers only to show the method; it does not give prices, and it does not replace a financial analysis by your finance team.
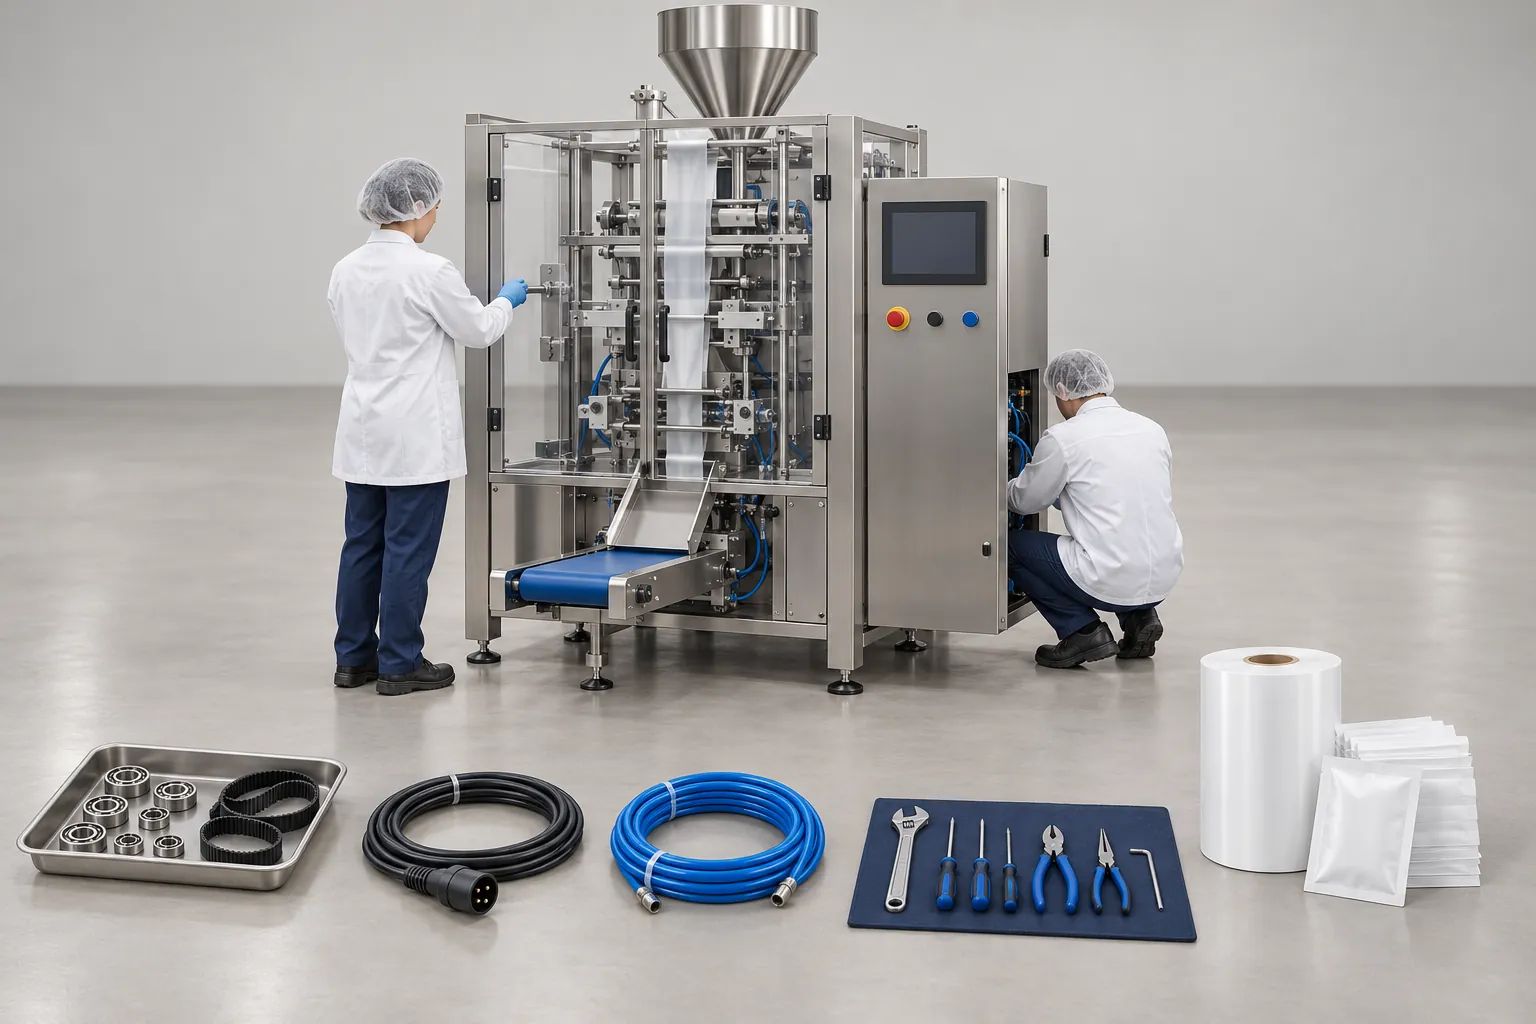
Comparing purchase price alone can hide recurring labor, changeover or support costs. In this simplified undiscounted model, TCO = acquisition + years × annual costs + decommissioning − residual value. Use the same period, units and scope for each offer; the quote breakdown explains how to align acquisition scope.
Swipe sideways to see the other columns. The first column stays visible.
| Model input | Basis to record |
|---|---|
| Formula | One-time costs + period × annual costs − residual value |
| Period | Same number of years and utilization for all offers |
| One-time costs | Acquisition/integration and end-of-life decommissioning |
| Annual costs | Operation, maintenance, downtime and changeover without overlap |
| Source | Quote revision, plant record or clearly labeled assumption |
Comparison table to fill in
Create one column per offer and use the same period for all of them. Use consistent units and note the source of each number: supplier quote, your own records or an estimate.
Copy this blank comparison into an editable document; amounts use one chosen currency and price basis.
Swipe sideways to see the other columns. The first column stays visible.
| Cost / timing | Unit | Offer A | Offer B | Source / assumption |
|---|---|---|---|---|
| Acquisition, once | currency | |||
| Operation, annual | currency/year | |||
| Maintenance, annual | currency/year | |||
| Downtime loss, annual | currency/year | |||
| Changeover cost, annual; exclude overlap | currency/year | |||
| Decommissioning, end of period | currency | |||
| Residual value, end of period; subtract | currency | |||
| Total over chosen years | currency |
For a worksheet with formulas, copy the tab-separated block below into spreadsheet cell A1, then edit every numeric input in columns B and C. Use numeric zero only for an explicit zero assumption; leave unknowns blank. The formula waits for all eight inputs. This is an editorial worksheet, not a discounted financial appraisal.
Input	Offer A	Offer B	Unit	Source / assumption
Period			years	Record basis
Acquisition			currency	Record basis
Operation			currency/year	Record basis
Maintenance			currency/year	Record basis
Downtime loss			currency/year	Record basis
Changeover (no overlap)			currency/year	Record basis
Decommissioning			currency	Record basis
Residual value (subtract)			currency	Record basis
TCO	=IF(COUNT(B2:B9)=8,B3+B2*SUM(B4:B7)+B8-B9,"Complete inputs")	=IF(COUNT(C2:C9)=8,C3+C2*SUM(C4:C7)+C8-C9,"Complete inputs")	currency	Undiscounted
Avoid double counting. If annual operation already includes the paid time used for changeovers, add only incremental changeover labor separately. Define a downtime-loss rate with finance and record which labor, margin or recovery costs it includes; do not also charge those same costs in operation or changeover. Distinguish a lost-output estimate from an invoice expense.
For unknown downtime cost, keep an unresolved assumption and test scenarios once a rate and hours are agreed; zero is not a measured absence of loss. If no resale evidence is available, label residual value zero as a scenario, retaining decommissioning cost. Give every cost one row and source before totaling it.
Data to collect for each offer
The numbers behind each row come from the supplier and from your own plant. Ask for the supplier’s figures and the conditions under which they apply; they are claims to verify, not measurements made by this publication.
- Operators needed per shift and their time on the machine
- Energy consumption under defined load, and compressed air consumption at the supply pressure
- Consumable and wear parts list, with life expectancy and the basis for it
- Recommended spares for the first period, and the preventive maintenance schedule
- Changeover time per format, and what you need to change parts or tools
- Expected scrap rate under the product and material you run
- Service contract options and exclusions
- Warranty duration and conditions
Takeaway: Assign each expense to one timing category and keep its source and assumption visible.
Worked example
Assumed example. Every number below is invented to show the arithmetic. None is measured or taken from the market, and none describes a real machine. The unit is the “cost unit” (CU), which has no relation to any currency. The example ignores the time value of money to keep the arithmetic simple; IEC 60300-3-3 discusses life cycle costing in more depth.
Two hypothetical machines, A and B, are compared over five years.
Swipe sideways to see the other columns. The first column stays visible.
| Component | Machine A | Machine B |
|---|---|---|
| Acquisition (one time) | 400 | 520 |
| Operation per year | 60 | 55 |
| Maintenance per year | 15 | 20 |
| Downtime and changeover per year | 50 | 25 |
| End of life (decommissioning less resale, net) | 10 | 0 |
The downtime and changeover figures come from assuming 250 changeovers per year, at 0.20 CU each for Machine A and 0.10 CU each for Machine B (including lost output).
The operation figures split as follows, per year.
Swipe sideways to see the other columns. The first column stays visible.
| Operation item | Machine A | Machine B |
|---|---|---|
| Labor | 28 | 28 |
| Energy and compressed air | 12 | 8 |
| Scrap | 16 | 15 |
| Consumables | 4 | 4 |
| Total | 60 | 55 |
Five-year totals:
- Machine A: 400 + (60 × 5) + (15 × 5) + (50 × 5) + 10 = 400 + 300 + 75 + 250 + 10 = 1,035 CU
- Machine B: 520 + (55 × 5) + (20 × 5) + (25 × 5) + 0 = 520 + 275 + 100 + 125 + 0 = 1,020 CU
Machine B has the higher acquisition cost (520 against 400, a difference of 120), but it is lower by 15 CU over five years. The gap is small, so the result depends on the assumptions. The next section tests them.
In this assumed example the offers are almost level. Review which assumptions could reverse this result before using it as a decision aid.
Takeaway: Use the CU example to check arithmetic; replace every input for a real decision.
Sensitivity: what changes the answer
Change one assumption at a time and recalculate. Keep the other values fixed so you can see which one matters. The following changes use the same invented numbers as the example, in CU.
Changeover frequency
If the plant needs only 125 changeovers per year instead of 250, the annual downtime and changeover cost halves for both machines, because the cost per changeover stays the same.
- Machine A: 125 × 0.20 = 25 per year, so 25 × 5 = 125 over five years. Total: 400 + 300 + 75 + 125 + 10 = 910 CU.
- Machine B: 125 × 0.10 = 12.5 per year, so 12.5 × 5 = 62.5. Total: 520 + 275 + 100 + 62.5 + 0 = 957.5 CU.
The ranking reverses: Machine A is now lower. A machine with faster changeover has more value in a plant with many formats and less in a plant that runs long campaigns. Estimate your own changeover times from records, not from supplier data alone.
Scrap rate
If scrap cost doubles for both machines, the scrap row grows by its own five-year value: Machine A adds 16 × 5 = 80, giving 1,115 CU; Machine B adds 15 × 5 = 75, giving 1,095 CU. The gap between them hardly changes because the assumed scrap difference is small. Scrap would matter more if the offers differed more in how they handle your product and material, which only a trial with your real material can show.
Energy and compressed air
If energy and compressed air prices double, the energy row adds its five-year value again: Machine A adds 12 × 5 = 60, giving 1,095 CU; Machine B adds 8 × 5 = 40, giving 1,060 CU. Machine B gains a little. Compressed air is often a costly utility to generate, and leaks and pressure settings affect consumption; the U.S. DOE compressed air sourcebook is a relevant reference for system efficiency, leaks and energy use. For motion systems, the difference between servo and pneumatic actuation affects both air use and machine capability, so ask each supplier for consumption data under stated conditions.
Other variables to test
- Planning period: a shorter or longer period changes the share of the acquisition cost
- Number of shifts and utilization
- Labor rates and operators per machine
- Spare parts prices and service response
- Resale assumptions, which are uncertain and should be tested at zero
- Price of the downtime hour, which depends on whether the machine is the line’s constraint
Takeaway: Identify the assumptions that reverse the ranking before choosing an offer.
What total cost of ownership includes
Total cost of ownership (TCO) is the sum of all costs attributable to the machine over a defined period, such as the planned service life or a fixed number of years. It groups costs into five parts.
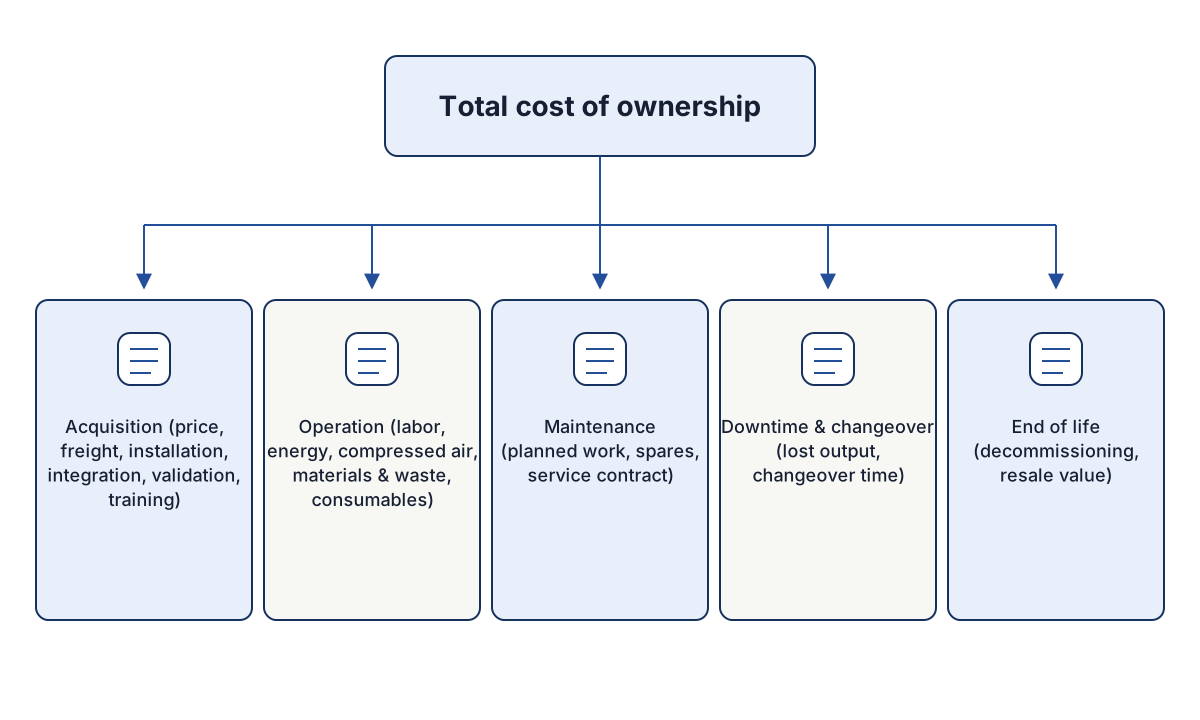
Acquisition covers price, freight, installation, integration, validation and training. Operation covers labor, energy, compressed air, materials and waste, and consumables. Maintenance is planned work, spares and any service contract. Downtime and changeover cover lost output and changeover time. End of life is decommissioning cost less resale value.
Costs that the supplier controls, such as price, are usually quoted. Costs that depend on your plant, such as labor and changeover frequency, you have to estimate. The framework puts both kinds in the same table.
Where the hidden costs sit
Acquisition costs outside the machine price are often left out: foundations, utility connections, conveyors, guarding changes, software for integration, trial material, and staff time for the acceptance tests. The RFQ checklist asks suppliers to state scope and exclusions so that these items show up in the comparison.
Downtime and changeover costs are also easy to miss because they appear as lost output, not as invoices. A machine that takes longer to change over, or stops more often, reduces the output you can sell. Constraint thinking helps here: check whether the stop actually limits sellable line output before valuing the loss, as explained in the guide to packaging line bottlenecks.
What sets the purchase price: how a quote is built
The acquisition row of the table starts with the quotation, and quotations for what looks like the same packaging equipment can differ widely. Most of that difference comes from what each quote includes, not from the machine alone. Reading a quote as a set of line items makes the difference visible.
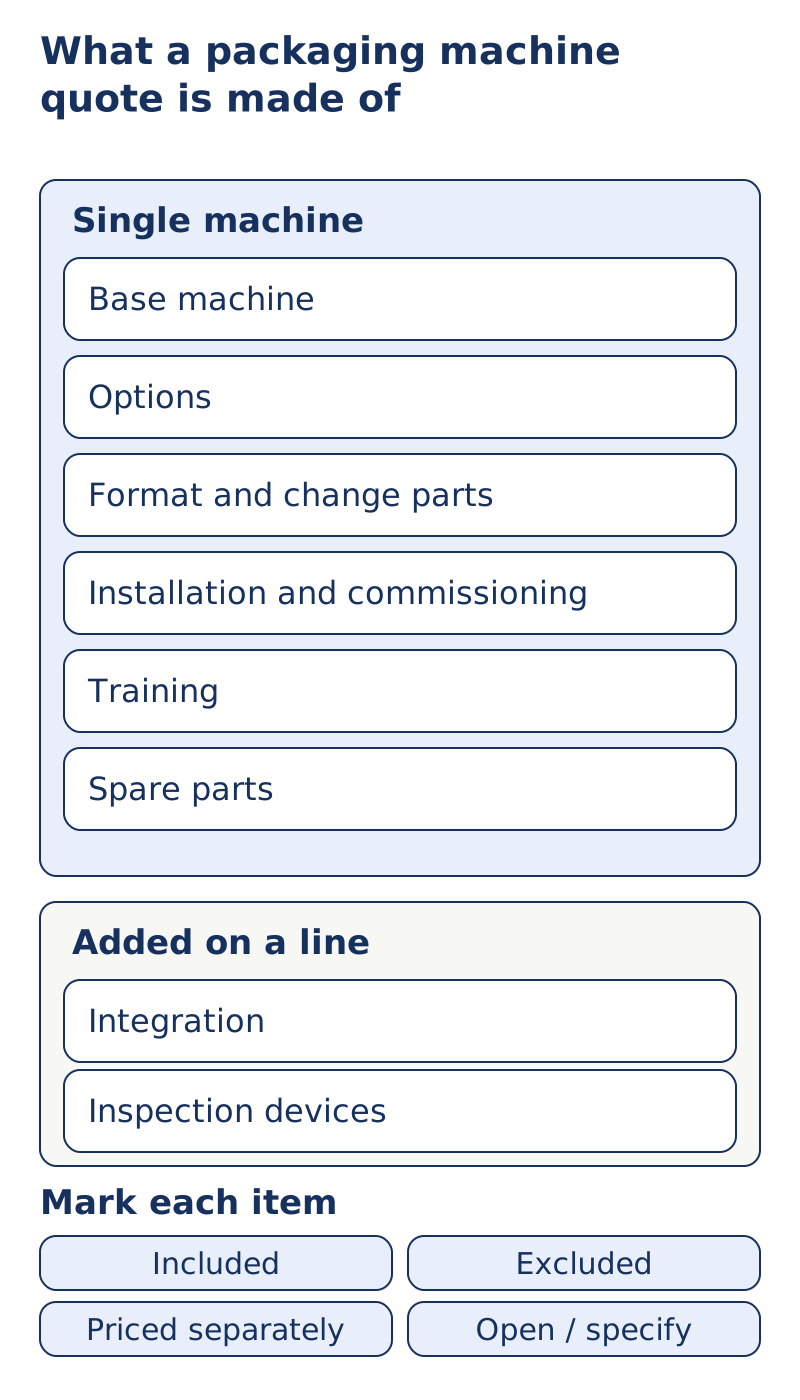
Line items in a packaging machine quote
- Base machine. The machine in its standard configuration for one defined format, with its standard controls.
- Options. Additions to the base machine, such as a dosing system matched to the product, a printer or coder, dust extraction, extra lanes, data connections or a different material of construction for product-contact parts.
- Format and change parts. The parts needed for each additional pack size or format, such as forming tubes, sealing jaws, guides, or forming and sealing tools. One format may be included; each further one is often priced separately.
- Installation and commissioning. Mechanical installation, connection to utilities, start-up and adjustment on your product, and the supplier’s travel and time on site.
- Training. Operator and maintenance training, where it takes place and for how many people.
- Spare parts. A recommended first set of spares and wear parts, listed by item.
On a line rather than a single machine, two further groups appear:
- Integration. Conveyors, guarding changes, control integration with upstream and downstream machines, and the engineering to tie them together. The line integration checklist lists the interface items that need a named owner.
- Inspection devices. Checkweighers, metal detectors or vision stations, with their reject devices, reject confirmation and the work to set up and verify them. These bring recurring costs too, such as routine test checks and spares, which belong in the operation and maintenance rows.
Documentation, acceptance tests, packing and freight complete the picture. Who carries freight, insurance and import costs depends on the delivery terms in the quote, so note them before comparing totals.
What moves the price
The specification choices below change the scope that a supplier has to quote. State each one in the request so every supplier quotes against the same basis.
Swipe sideways to see the other columns. The first column stays visible.
| Price driver | Why it moves the quote | What to state in the request |
|---|---|---|
| Level of automation | Manual, semi-automatic and automatic machines differ in how many steps the machine performs and how much labor stays with operators | Which steps must be automatic: feeding, dosing, sealing, collation, reel change |
| Output target | Higher output can mean more lanes, a faster machine type or a second machine | Required packs per minute with the product, pack size and counting basis |
| Number of formats | Each pack size or format adds change parts and changeover work | Every size you plan to run, now and later |
| Product behavior | Dusty, sticky, liquid or fragile products need suited dosing, sealing and cleaning features | Product description and samples |
| Pack type | Reel-fed pouches, premade pouches, stick packs, blisters and cartons need different machine families and tooling | Pack drawing and material specification |
| Hygiene and contact materials | Washdown design and product-contact materials change construction | Cleaning method and contact-material requirements |
| Controls and data | Recipe management, data export and line communication add engineering | Required signals, data and network interface |
| Documentation and validation | Regulated products need more documentation and test protocols | Documents and validation steps you require |
| Safety and market requirements | Guarding and documentation follow the market where the machine is installed | Destination market and applicable references |
Why two quotes for the same machine differ
Before entering any quote in the comparison table, split it into the same line items and mark each one as included, excluded, priced separately or open for written clarification. Typical gaps are change parts for only one format, installation without commissioning on your product, spares listed without quantities, acceptance tests not mentioned, and a quote validity date or currency that differs from the others. The RFQ checklist asks for scope and exclusions in a form that makes this split easier.
Pouch, blister and small machines
The same structure answers narrower questions such as how much a pouch packing machine or a blister packaging machine costs. For pouches, the first price question is whether the pouch is formed from reel film or bought premade, because the two use different machine families; the VFFS vs. premade pouch guide compares them. For blister packaging, ask for the tooling for each layout item by item; its cost share depends on the quote. For stick packs, lane count and dosing per lane drive the scope, as covered in the stick pack vs. sachet guide.
A small or semi-automatic machine may carry a lower purchase price, but it can move cost into the operation row as operator time. The table below catches that shift only if labor is estimated for each offer at the output you need.
Takeaway: Align included and excluded scope before copying the acquisition total.
Questions to ask suppliers
Request the data that fills the table, and ask how each figure was derived.
- What consumption of electricity and compressed air do you state, and under what load and conditions?
- Which wear parts need replacement, at what interval, and at what cost?
- What is the changeover procedure and its stated time for each format, and what tools are needed?
- Which spares do you recommend for the first operating period?
- What does the service contract include and exclude, and what is the response time?
- What training is included, and what costs extra?
- What is the expected life of the main components, and what is it based on?
- Which upgrades or format additions can be added later, and at what scope?
Also check that the figures can be verified at acceptance. Link the stated figures to tests in the acceptance plan so that a number claimed in the quotation can be checked on the machine.
Limits and on-site verification
A TCO model is only as good as its inputs. Supplier figures for consumption, wear life and changeover time depend on the product, the material, the settings and the operators, and they are not measurements made by this publication. Verify them with your own product and material on the actual machine, and update the model with your records after startup. The numbers in the worked example are invented and must not be used as estimates for any real machine.
Maintenance planning depends on the machine manual, your failure history and your site risk assessment, with qualified personnel; see the preventive maintenance checklist for how a task list is built. Maintenance terminology is covered by EN 13306, and ISO 22400-2 defines manufacturing KPIs such as OEE, which you can use to track the downtime and loss assumptions after startup. Financial treatment, such as discounting, depreciation and tax, belongs to your finance team.
Related decisions
Put the same cost structure into every quotation request, starting with the RFQ checklist so offers are comparable. After the order, tie the main figures to tests so the claims behind the model can be verified.
References
- IEC 60300-3-3:2017 — Dependability management — Part 3-3: Application guide — Life cycle costing — IEC
- Improving Compressed Air System Performance: A Sourcebook for Industry (Second Edition) — U.S. Department of Energy, Office of Energy Efficiency and Renewable Energy, with the Compressed Air Challenge
- EN 13306:2017 — Maintenance — Maintenance terminology — CEN
- ISO 22400-2:2014 — Automation systems and integration — Key performance indicators (KPIs) for manufacturing operations management — Part 2: Definitions and descriptions — ISO
Update history
- : First published.
- : Added a section on what sets the purchase price: the line items in a packaging machine quote, the specification choices that move it, and how to make two quotes comparable before entering them in the cost table.
- : Moved the core worksheet and assumed example ahead of quote detail, separated recurring and one-time costs and net residual value, clarified double counting, and redrew the cost map.
Next steps

Packaging Machine RFQ Checklist: Information Suppliers Need
A reusable blank RFQ template for packaging machines in nine sections, with the reason suppliers need each item and a list of commonly missed details.
Read guide
FAT vs. SAT for Packaging Equipment: Defining Acceptance Criteria
Compare factory and site acceptance tests for packaging machines, and learn how to write acceptance criteria that both buyer and supplier can verify.
Read guide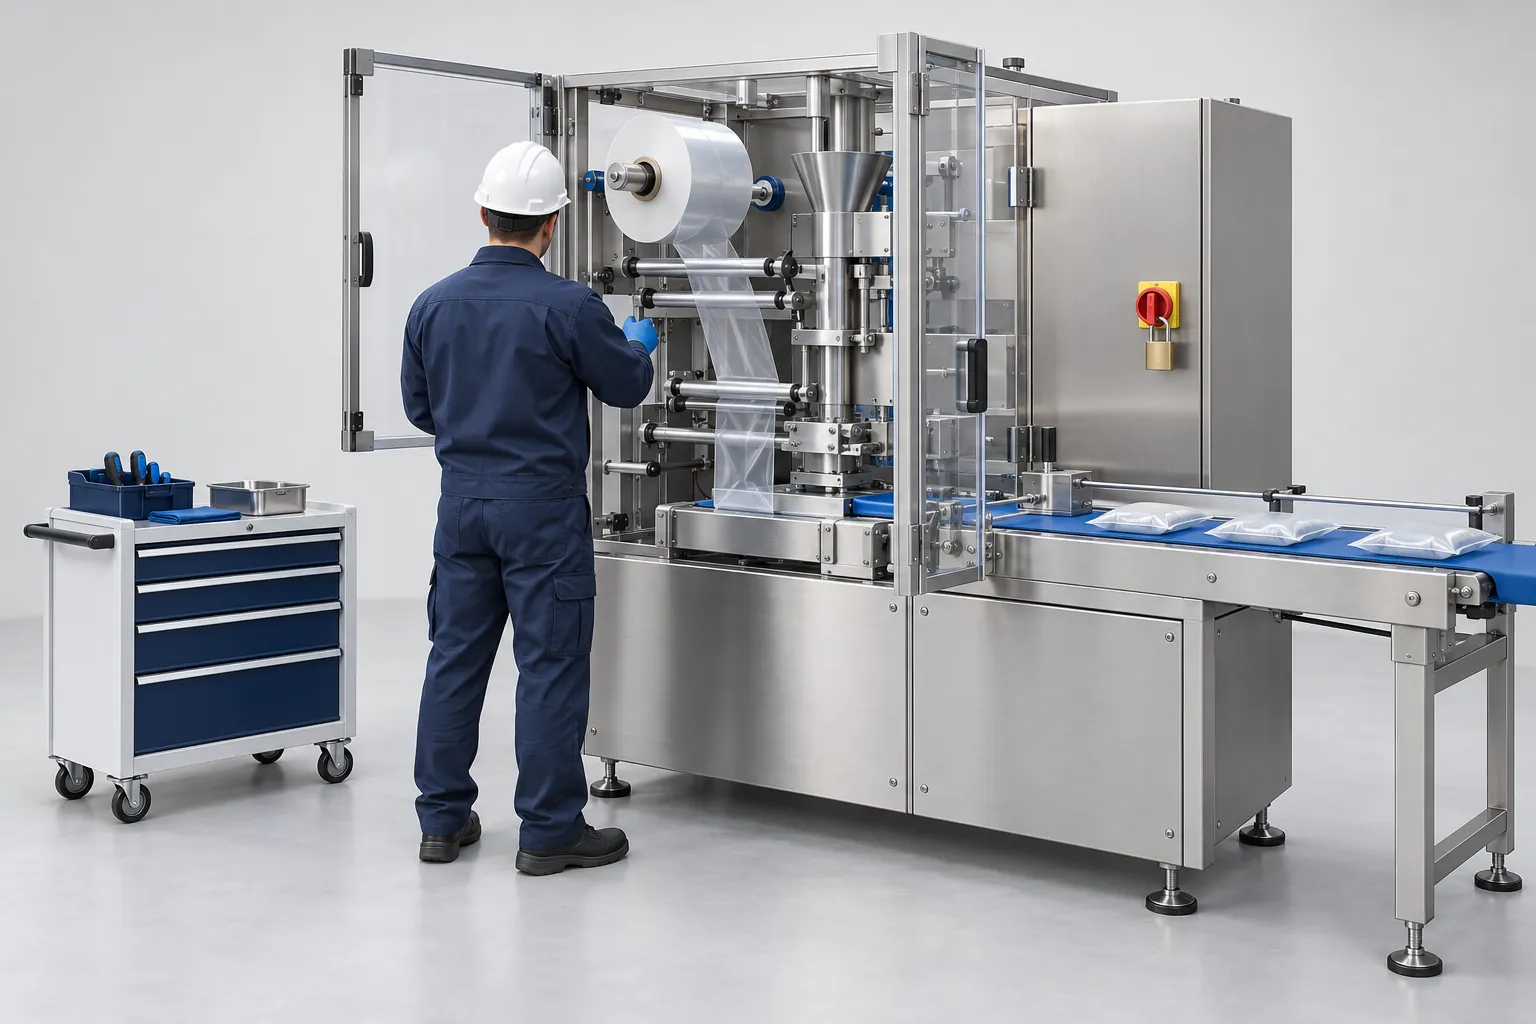
Packaging Machine Preventive Maintenance: Building a Site-Specific Checklist
Build a preventive maintenance checklist for packaging machines from OEM manuals, failure history, risk assessment and critical spares, with a task list.
Read guide