
Finding Packaging Line Bottlenecks with Basic Production Data
Identify candidate packaging-line constraints using four analysis groups, measured good-pack counts and running rates, with a worked example and copyable shift log.
Four analysis groups—running, starved, blocked and down—can locate a candidate constraint where upstream machines are blocked and downstream machines are starved. State time alone does not prove it: record good-pack counts and actual running rates over several representative shifts. A continuously running machine with no own stops can still constrain output at a low rate.
Applies to: Covers a serial packaging line of individual machines linked by conveyors, using per-machine state times recorded over a shift. Does not cover simulation, line balancing for new designs, or machine-specific fault diagnosis.
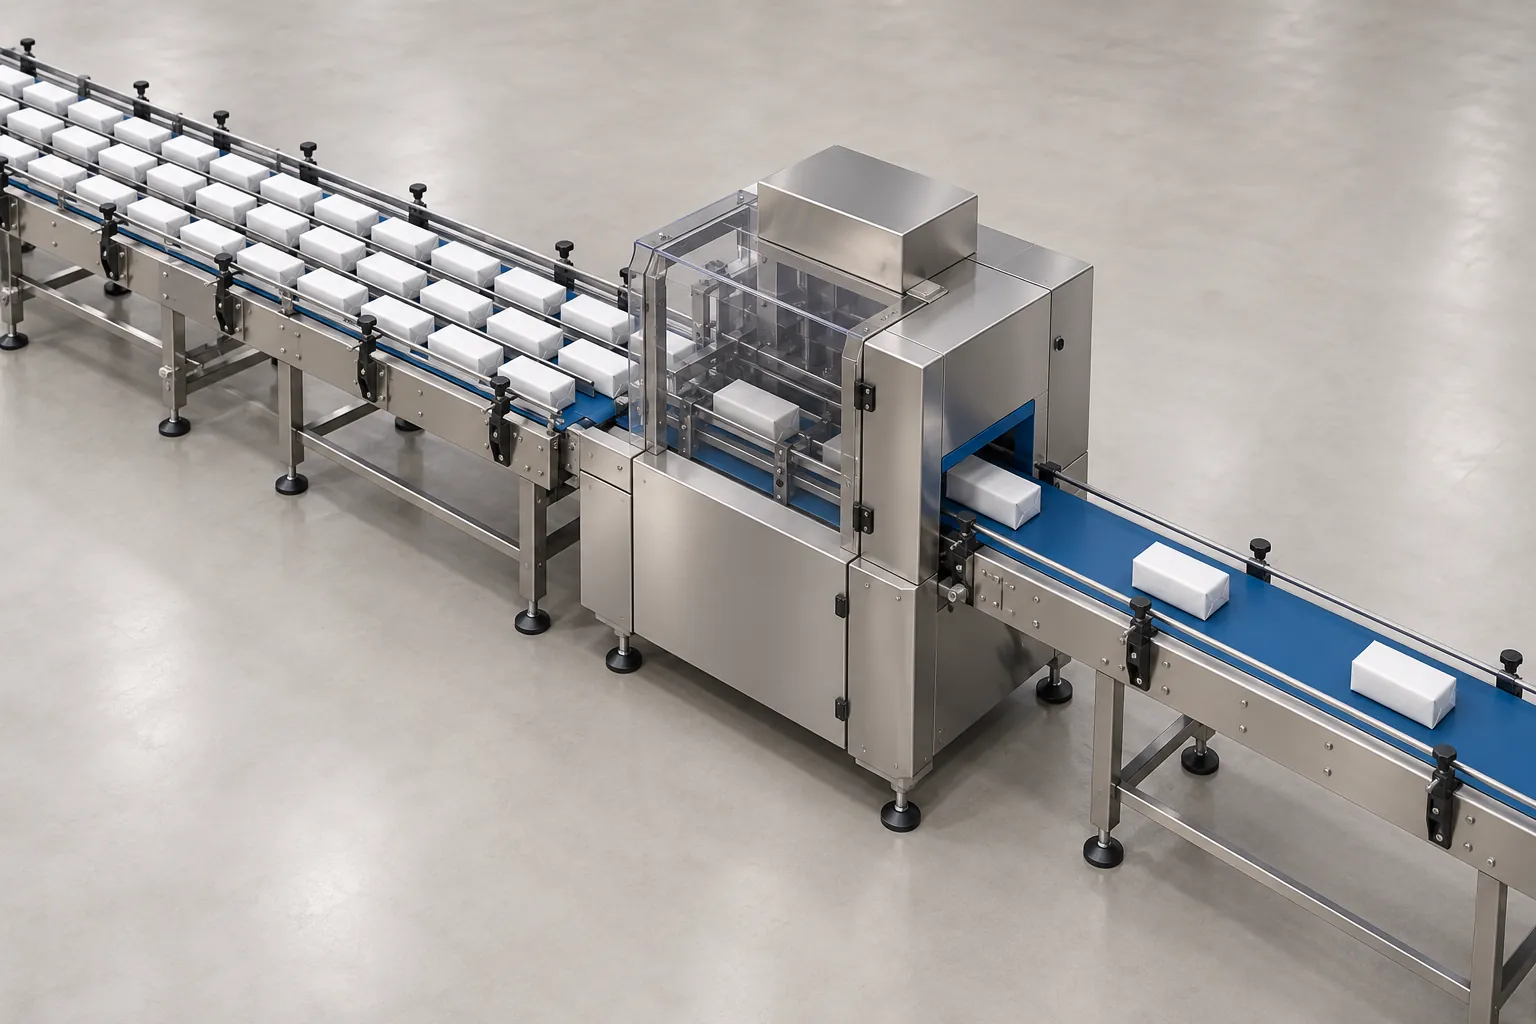
Missed output can send maintenance work to the wrong machine. Use the waiting pattern to shortlist a constraint, then compare measured good-pack output and actual running rates across representative shifts; zero own downtime does not rule out a low-rate constraint.
Swipe sideways to see the other columns. The first column stays visible.
| Analysis group | Meaning in this article | Pattern to inspect |
|---|---|---|
| Running | Operating and producing output | Record actual rate and good packs, not just running minutes |
| Starved | Ready but missing upstream supply | May appear downstream of a constraint |
| Blocked | Unable to discharge into a full downstream path | May appear upstream of a constraint |
| Down | Own stop: fault, intervention, planned stop or changeover | Record the reason separately; longest downtime alone is not proof |
These are our analysis groups, not PackML state names. Use the copyable shift log and keep the product, counting unit and observation window consistent.
How machine states reveal the constraint
After recording the limiting condition, the automation scope checklist helps compare a station intervention with a connected cell or line project.
In a serial line, product moves from one machine to the next. For this analysis each machine is in one of four states at any moment.
Keep waiting losses separate from the machine’s own stops. A generic “stopped” total cannot do that without reason signals.
Map controller signals before collecting minutes
OMAC’s PackML resources describe a common machine-data framework. Beckhoff’s public implementation documents separately list state outputs such as Execute, Suspended, Held, Stopped and Aborted, and Blocked/Starved equipment tags. Checked October 8, 2026; these documents describe an implementation, not a universal mapping for your line.
Swipe sideways to see the other columns. The first column stays visible.
| Group | Signals to review with the controls team |
|---|---|
| Running | Execute plus actual production/count evidence |
| Starved / blocked | State together with upstream-empty or downstream-full reason/tag; Suspended alone does not distinguish them |
| Down | Own-stop reason alongside states such as Held, Stopped or Aborted; a state name alone does not establish the cause |
Agree one exclusive group per instant, reason priority when signals overlap, transition handling and the counting window. Do not count simultaneous reasons twice. Keep unresolved observations flagged for review.
The logic comes from the Theory of Constraints literature: the throughput of a serial system is governed by its bottleneck, and effort spent elsewhere does not raise output. On a line the constraint leaves a recognizable signature:
- Machines upstream of the constraint fill their outfeed conveyors and spend time blocked.
- Machines downstream of the constraint wait for product and spend time starved.
- A candidate may show little blocked or starved time. Its own stops or a sustained low running rate can limit output; check good-pack counts before assigning the constraint.
Reading the pattern: a worked example
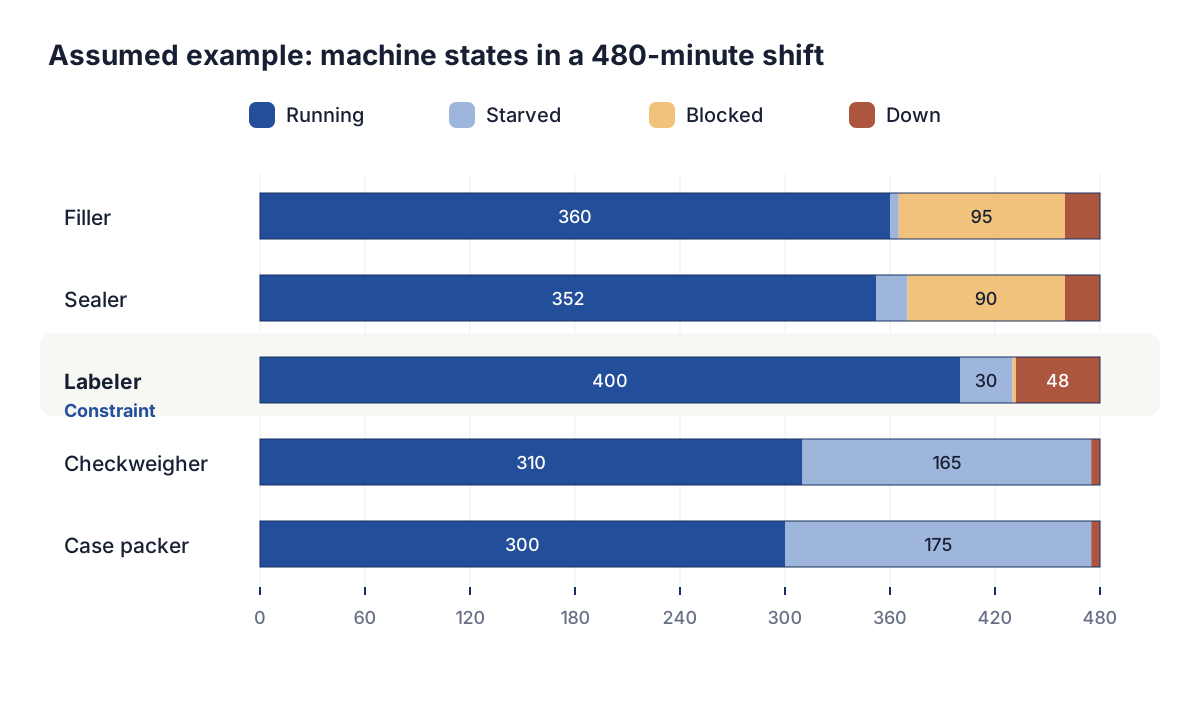
The table below uses assumed numbers. Every row adds up to the 480-minute shift.
Assumed example. These figures were made up to show the method. They are not measured data and do not describe any real line.
Filler — assumed rated speed 120 packs/min.
Swipe sideways to see the other columns. The first column stays visible.
| Running (min) | Starved (min) | Blocked (min) | Down (min) |
|---|---|---|---|
| 360 | 5 | 95 | 20 |
Sealer — assumed rated speed 130 packs/min.
Swipe sideways to see the other columns. The first column stays visible.
| Running (min) | Starved (min) | Blocked (min) | Down (min) |
|---|---|---|---|
| 352 | 18 | 90 | 20 |
Labeler — assumed rated speed 125 packs/min.
Swipe sideways to see the other columns. The first column stays visible.
| Running (min) | Starved (min) | Blocked (min) | Down (min) |
|---|---|---|---|
| 400 | 30 | 2 | 48 |
Checkweigher — assumed rated speed 150 packs/min.
Swipe sideways to see the other columns. The first column stays visible.
| Running (min) | Starved (min) | Blocked (min) | Down (min) |
|---|---|---|---|
| 310 | 165 | 0 | 5 |
Case packer — assumed rated speed 140 packs/min.
Swipe sideways to see the other columns. The first column stays visible.
| Running (min) | Starved (min) | Blocked (min) | Down (min) |
|---|---|---|---|
| 300 | 175 | 0 | 5 |
| Check: Filler 360 + 5 + 95 + 20 = 480. The other four rows also sum to 480. |
Start with the machines before the Labeler. The Filler spent 95 of 480 minutes blocked and the Sealer 90. They were ready to run but had nowhere to put their output, so their running time (360 and 352 minutes) was limited by the machine after them, not by their own capability.
The machines after the Labeler show the opposite pattern. The Checkweigher spent 165 minutes starved and the Case packer 175, and neither was blocked at all. They sat waiting for product that did not arrive fast enough.
The Labeler sits between the two groups. It was blocked for only 2 minutes and starved for 30. It ran for 400 of 480 minutes, a running share of 400/480, or about 83 percent, the highest on the sheet. Its 48 minutes of down time is also the highest, against 20 each for the Filler and Sealer and 5 each for the last two machines.
Taken together, the Labeler is the strongest candidate for the constraint: the machines before it back up, the machines after it wait, and it loses the most time to its own stops. It is not the machine with the lowest rated speed. The Filler has that at 120 packs per minute, yet that rating alone does not establish the constraint. It spends 95 minutes blocked because the machine two steps downstream cannot take everything it could make.
The next step is to investigate why the Labeler stops: which causes, how often, and how long each stop lasts. After that, check whether a buffer conveyor between the Labeler and its neighbors could absorb short stops. Before changing speeds or buffers, verify the candidate with actual rates and good counts over more shifts.
Why rated speed is not capacity
A rated speed is the speed a machine is designed or quoted to reach under defined conditions with a defined product and pack. Real output can differ from that rating for these reasons:
- The machine spends time in states other than running.
- It may run below rated speed to hold seal quality, fill accuracy or label placement with the actual product and material.
- Its neighbors may limit it through starving and blocking.
- Short stops that never reach a downtime log still cut output.
Rated speed helps when comparing equipment during selection, as described in the guide on packaging machine types. It does not forecast what the line will deliver in a shift. State times come from what actually happened, though you still need counts of good packs to turn them into output.
Building the data set
You do not need a historian to start. A defensible first data set has the elements below.
Swipe sideways to see the other columns. The first column stays visible.
| Element | What to capture | Why it matters |
|---|---|---|
| Time window | At least several full shifts under normal production | One unusual shift can point at the wrong machine |
| State definitions | Written, agreed, and identical for every machine | Prevents one operator calling a jam “down” and another “blocked” |
| Stop reasons | A short code list for down time | Turns the constraint finding into a target for action |
| Product and format | Which product and pack size ran | Constraints often move between formats |
| Counts | Good packs and rejects per machine | Links state time to output |
Many controllers can supply state time and counters directly if the machine publishes them through its interface. Ask the machine supplier whether yours can. The line integration checklist lists the signals worth specifying so that “ready”, “running”, “fault”, “full” and “empty” are available from each machine.
Copyable shift log
Copy this tab-separated block to cell A1 of a spreadsheet. One row represents one machine and one product within a defined window. Enter measured minutes and counts; explicitly label assumed inputs in the last column. Duplicate the row with formulas adjusted for its new row number.
Shift	Product / format	Machine	Window min	Running min	Starved min	Blocked min	Down min	Good count / unit	Loss reason	Total min	Check	Measured or assumed / source
										=IF(COUNT(E2:H2)=4,SUM(E2:H2),"")	=IF(COUNT(D2:H2)<5,"INCOMPLETE",IF(MIN(D2:H2)<0,"CHECK NEGATIVE",IF(K2=D2,"OK","CHECK TOTAL")))	ENTER SOURCE
The check flags missing, negative or mismatched minutes; “OK” does not validate signal meaning. Calculate actual running rate from the production counter change divided by running minutes, retaining rejects separately; do not divide by zero or compare different counting units.
If logs disagree with the floor, compare timestamps, counter positions and full/empty sensors during the same observed event. Ask the controls team to review the state/reason mapping before changing the grouping or proposing equipment changes.
Check the constraint can move
A constraint does not stay put. After you improve the Labeler, the next-slowest machine becomes the new limit, and product changes, speed changes and downtime patterns also move it. Re-run the state analysis after each change instead of assuming the previous finding still holds.
How this relates to OEE
OEE combines availability, performance and quality into one figure for a machine or line. ISO 22400-2 defines manufacturing KPIs such as OEE, and the grouping of losses into availability, speed and quality categories traces back to total productive maintenance literature. For a full worked shift walk-through with PackML timers, V-curve speed ratios and accumulation buffer sizing, see the packaging line OEE calculation and bottleneck analysis guide.
State times feed the availability part of that figure directly. Three practical points follow:
- Use OEE at the constraint to see what limits plant output. An hour lost at a non-constraint machine that was blocked anyway may cost nothing in output.
- Do not average OEE across all machines and call the result line performance. Blocked and starved time is a symptom of the constraint, not a loss at the machine that shows it.
- Decide whether blocked and starved time count as availability loss for each machine. Sites define this differently, so write yours down.
If a line shows a low OEE figure and no one can say where the loss sits, the state table above is a cheaper next step than another dashboard.
Information to request from suppliers
When you can influence the data you will get, ask each machine supplier for:
- The list of machine states published on the controller and how each maps to running, starved, blocked and down.
- Which counters are available: good packs, rejects, total starts, and time per state.
- How stops are classified and whether operator-entered reason codes can be attached.
- The interface and data points for exporting this information, and in what format.
- The conditions behind the quoted rated speed, including product, pack format and material.
- The sensor positions that detect “outfeed full” and “infeed empty” and how they are set.
Checklist for a first bottleneck review
- State definitions written and shared with operators and maintenance.
- State times recorded for each machine for several representative shifts.
- Stop reasons captured for down time, with a short code list.
- Product and format recorded alongside each shift.
- Blocked and starved shares calculated for every machine.
- Candidate constraint identified from the pattern across the line.
- Top stop causes at the candidate listed before any equipment change is proposed.
Limits and on-site verification
This method points at a candidate. It does not prove it, and several conditions can mislead.
- If operators feed or clear a machine by hand, the state log may not reflect what the machine could do on its own.
- Stops of a few seconds may not register as down time, which hides losses at the constraint.
- An upstream dryer, a shared compressed air supply, or a single operator covering two machines can limit several machines at once.
- The constraint at one pack size may not be the constraint at another.
- Blocked and starved times are only as accurate as the sensors that detect full and empty conditions.
Confirm the finding by watching the line, checking the stop log against what you see, and testing with real product. Any change to speeds, buffers or guarding needs review by qualified engineers. For safety-related changes, that includes a risk assessment under ISO 12100 or the equivalent in your market.
Related decisions
Once the constraint is known, its stops need causes and plans. A preventive maintenance checklist helps reduce repeat failures, and a format changeover checklist addresses the changeover time that often dominates down time on multi-format lines. If the constraint is at the end of the line, the cartoner versus case packer comparison clarifies which role the machine plays. When a fix means buying equipment, compare the lost output against the total cost of ownership of the options, not only the purchase price.
References
- ISO 22400-2:2014 — Automation systems and integration — Key performance indicators (KPIs) for manufacturing operations management — Part 2: Definitions and descriptions — ISO
- Eliyahu M. Goldratt and Jeff Cox, The Goal: A Process of Ongoing Improvement (North River Press, first published 1984) — North River Press
- Seiichi Nakajima, Introduction to TPM: Total Productive Maintenance (Productivity Press, 1988) — Productivity Press
- PackML (Packaging Machine Language) - OMAC — OMAC (Organization for Machine Automation and Control)
Update history
- : First published.
- : Separated analysis groups from PackML signals; added measured-output validation, vertical assumed records and a spreadsheet log with total checks.
Next steps
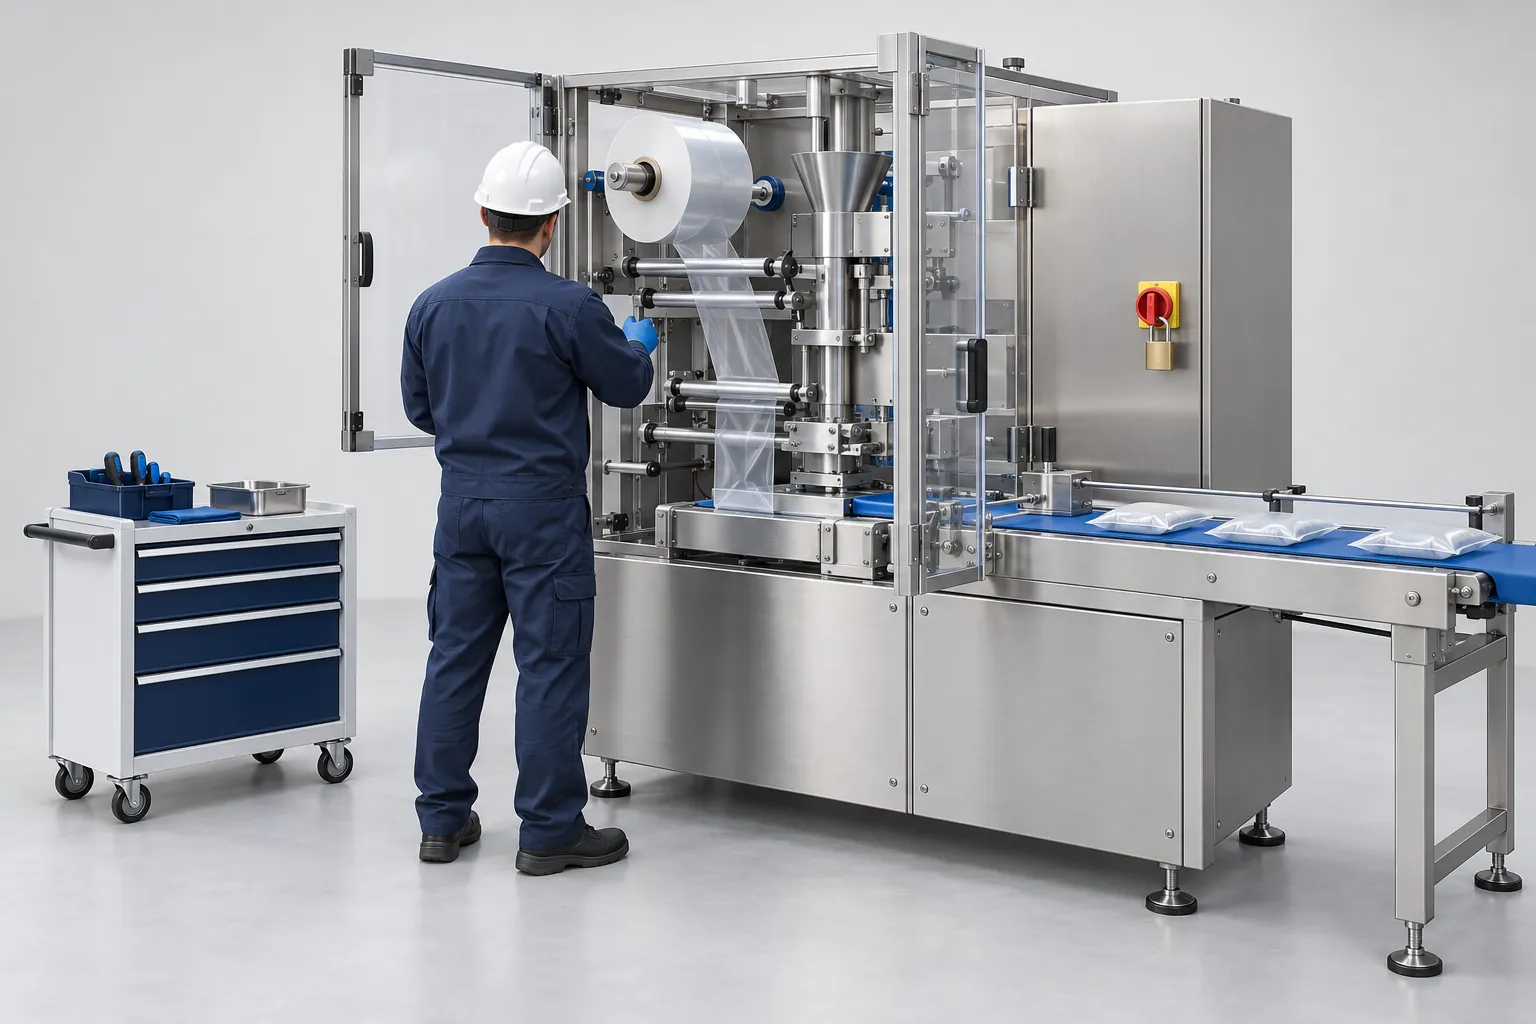
Packaging Machine Preventive Maintenance: Building a Site-Specific Checklist
Build a preventive maintenance checklist for packaging machines from OEM manuals, failure history, risk assessment and critical spares, with a task list.
Read guide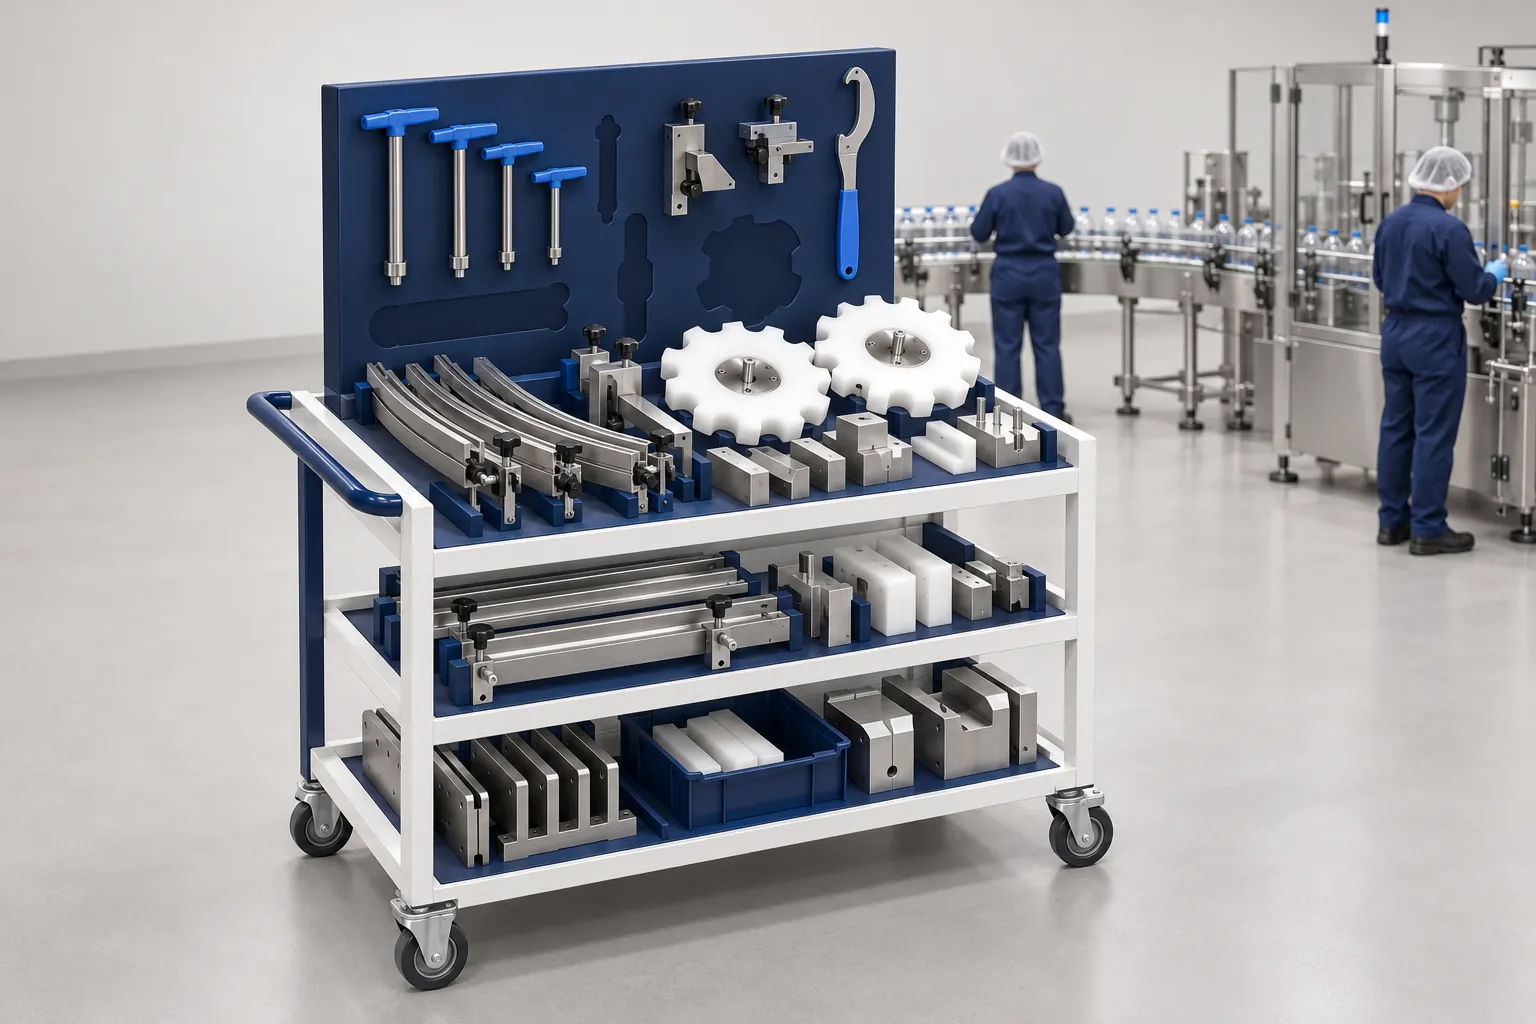
Packaging Format Changeovers: What to Record and Verify
A format changeover checklist: seven steps from preparation to run monitoring, a record template, and the SMED idea of external versus internal work.
Read guide
Packaging Machine Total Cost of Ownership: A Comparison Framework
Compare packaging machine offers by total cost of ownership: cost components, a fill-in table, an example with invented numbers and a sensitivity check.
Read guide